

Debugging embedded bootloaders can often feel like working in the dark. When execution crashes or behaves unexpectedly, the first question an engineer usually asks is, “How did I get here?”
Of course, one should always have a JTAG debugger ready to press into service, but so few boards provide a JTAG header.
To help, a recent series introduces a standardised Backtrace Library and a corresponding command to U-Boot. While currently implemented for the sandbox architecture, the design provides a generic API that paves the way for runtime stack traces across other architectures in the future.
The Power of Context
Previously, getting a call stack in U-Boot often meant attaching an external debugger (like GDB) or manually instrumenting code with print statements. This series adds runtime support to look at the backtrace directly from the console.
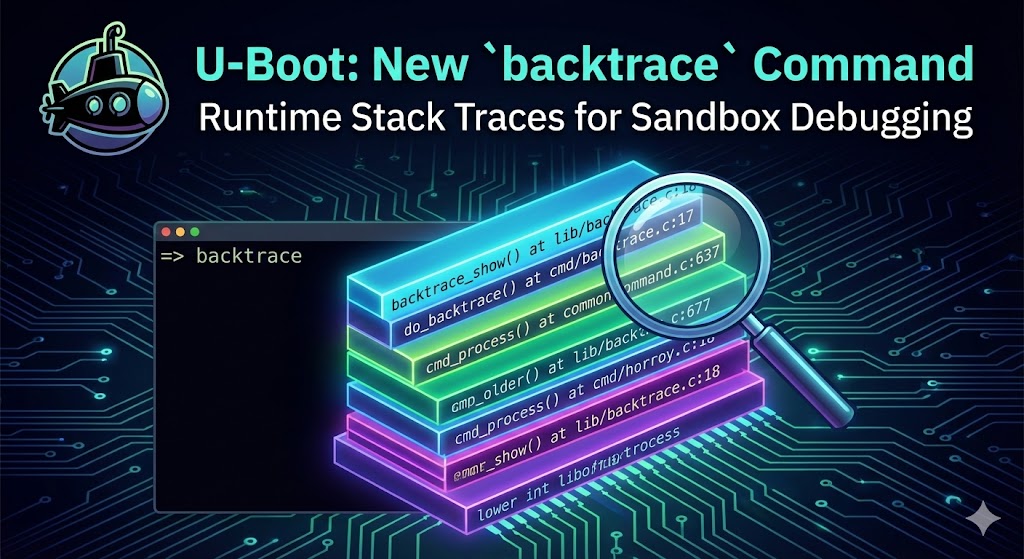
With the new backtrace command, developers can instantly see the call stack, complete with function names, source filenames, and line numbers.
How it Works
The implementation is split into a generic library and architecture-specific drivers:
- Generic API (
include/backtrace.h): Provides functions likebacktrace_init()to collect the stack andbacktrace_show()to print it. - Sandbox Implementation: For sandbox, we use the host’s
libbacktrace(bundled with GCC). This allows U-Boot to read the DWARF debug information generated during the build to resolve addresses into human-readable symbols.
Cleaner Output
Raw backtraces can be messy, often printing absolute paths that clutter the terminal. A nice touch in this series (specifically Patch 9) is the automatic stripping of the source tree prefix.
Before:
run_command_list() at /home/user/workspace/u-boot/common/cli.c:168
After:
run_command_list() at common/cli.c:168
Example Usage
Once enabled with CONFIG_CMD_BACKTRACE, using the tool is straightforward:
=> backtrace
backtrace: 14 addresses
  backtrace_show() at lib/backtrace.c:18
  do_backtrace() at cmd/backtrace.c:17
  cmd_process() at common/command.c:637
  run_list_real() at common/cli_hush.c:1868
  parse_stream_outer() at common/cli_hush.c:3207
  parse_string_outer() at common/cli_hush.c:3257
  run_command_list() at common/cli.c:168
  sandbox_main_loop_init() at arch/sandbox/cpu/start.c:153
  board_init_r() at common/board_r.c:774
  ...
Looking Ahead
Currently this feature relies on libbacktrace and is available only for sandbox. However, the infrastructure is now in place. We are looking forward to seeing architecture maintainers implement the backing backtrace_init logic for ARM, RISC-V, and x86 to bring this powerful debugging capability to physical hardware.
This backtrace command is a great addition to U-Boot, especially for debugging embedded systems without JTAG support. Being able to instantly access the call stack from the console should save a lot of time and effort, and I’m excited to see how it expands to other architectures.
This backtrace command is a nice step forward for debugging U-Boot, especially since JTAG isn’t always available. It’s great to see the split into a generic API and architecture-specific drivers — that approach makes it much more scalable. The ability to get function names and line numbers directly from the console will definitely save a lot of time during development and troubleshooting.