Pickman is a tool for cherry-picking patches from upstream U-Boot into a downstream branch. It walks the first-parent chain of the source branch, finds merge commits, and cherry-picks their contents one merge at a time using an AI agent.
This works well for normal merges containing a handful of commits. But upstream U-Boot occasionally has mega-merges — large merges whose second parent itself contains sub-merges. A single Merge branch ‘next’ can pull in dozens of sub-merges, each with their own set of commits, totalling hundreds of patches.
Feeding all of these to the AI agent at once overwhelms it. The context window fills up, conflicts become harder to diagnose, and a single failure can require restarting a very large batch. A better approach is to break the mega-merge into smaller pieces and process them one at a time.
The problem
Consider a typical mega-merge on the first-parent chain:
When pickman encounters merge M, it collects all commits in prev..M and hands them to the agent. For a normal merge this is fine, a few commits at most. But when S1, S2 and S3 are themselves merges, each containing many commits, the batch can be very large.
The solution
Two new functions handle this:
detect_sub_merges(merge_hash) – examines the second parent’s first-parent chain to find merge commits (sub-merges) within a larger merge. Returns a list of sub-merge hashes in chronological order, or an empty list if no sub-merges are present.
decompose_mega_merge(dbs, prev_commit, merge_hash, sub_merges) – returns the next unprocessed batch from a mega-merge.
The second function handles three phases:
Mainline commits — commits between the previous position and the merge’s first parent (prev..M^1). These are on the mainline and are not part of any sub-merge.
Sub-merge batches — one sub-merge at a time, skipping any whose commits are already tracked in the database. Each call returns the commits for the next unprocessed sub-merge.
Remainder commits — any commits after the last sub-merge on the second parent’s chain.
The function tracks progress via the database: commits that have been applied (or are pending in an open MR) are skipped automatically. On the next invocation, pickman picks up where it left off.
The advance_to field in NextCommitsInfo tells the caller whether to update the source position. When processing sub-merge batches, it is None (stay put, more batches to come). When the mega-merge is fully processed, it contains the merge hash so the source advances past it.
The next-merges command also benefits: it now expands mega-merges in its output, showing each sub-merge with a numbered index:
When something goes wrong partway through a mega-merge, it helps to be able to step backwards. The new rewind command walks back N merges on the first-parent chain from the current source position, deletes the corresponding commits from the database, and resets the source to the earlier position.
By default it performs a dry run, showing what would happen:
    $ pickman rewind us/next 2
    [dry run] Rewind 'us/next': abc123456789 -> def567890123
      Target: def5678901 Merge branch 'dm-next'
      Merges being rewound:
        abc1234abcd Merge branch 'video-next'
        bbb2345bcde Merge branch 'usb-next'
      Commits to delete from database: 47
    Use --force to execute this rewind
It also identifies any open MRs on GitLab whose cherry-pick branches correspond to commits in the rewound range, so that these can be cleaned up (normally deleted).
Summary
These changes allow pickman to handle the full range of upstream merge topologies with less manual intervention. Normal merges continue to work as before. Mega-merges are transparently decomposed into manageable batches, with progress tracked across runs and the ability to rewind when needed.
Running U-Boot x86_64 Directly from ROM Without SPL
written by Simon Glass | 6 March 2026
Introduction
U-Boot on x86_64 has traditionally relied on a Secondary Program Loader (SPL) to bootstrap into 64-bit mode. SPL starts in 16-bit real mode (as required by the x86 reset vector), transitions through 32-bit protected mode, sets up page tables, and finally jumps into the 64-bit U-Boot proper.
A recent series adds support for running U-Boot directly from ROM on x86_64 without SPL, using QEMU as the development platform. While this is a simpler configuration, getting it to work required solving several interesting architectural challenges at the intersection of x86 hardware, compiler conventions, and virtual-machine emulation.
Why Skip SPL?
The SPL adds complexity and boot time. On platforms like QEMU where the firmware image runs directly from a flat ROM, the extra SPL stage is unnecessary. A single-binary U-Boot that transitions from 16-bit to 64-bit mode internally is simpler to build, debug, and deploy.
This also serves as a foundation for future work on other x86_64 platforms that may not need SPL.
The Challenges
Read-only .data in ROM
When running from ROM (SPI flash), the .data section is in read-only flash memory. The existing x86_64 code stored the global data (gd) pointer in a global variable, which lives in .data. Writing to it before relocation to RAM would fault.
The solution was to use MSR_FS_BASE to hold the gd pointer address, mirroring how 32-bit x86 uses the FS segment descriptor base. This is a CPU register, so it works regardless of whether .data is writable:
This seemingly simple change had a knock-on effect: EFI runtime services that accesses gd->relocaddr crashes when the Linux kernel called SetVirtualAddressMap(), because the kernel repurposes the FS register for its own per-CPU data. The fix was to cache gd->relocaddr in an __efi_runtime_data variable during U-Boot initialisation, before the kernel takes over.
Mixing 32-bit and 64-bit Code
The x86 reset vector runs in 16-bit real mode. U-Boot’s existing 16-bit startup code (start16.S, resetvec.S) is designed for 32-bit builds. On x86_64, the main binary is compiled as position-independent 64-bit code (PIE), which is fundamentally incompatible with 16-bit/32-bit startup code.
The solution was to compile the 16-bit startup objects as 32-bit code and link them into a separate 32-bit ELF, then extract just the raw binary from it. The build system includes this binary in the final ROM image at the correct reset vector address. This required several build-system changes:
Moving 16-bit binary rules from the top-level Makefile to arch/x86/Makefile
Compiling startup objects with explicit -m32 flags on x86_64
Linking them into a separate 32-bit ELF (u-boot-x86-start16.elf) distinct from the 64-bit main binary
32-bit to 64-bit Transition
A new assembly file (start_from_32.S) handles the transition from the 32-bit startup environment to 64-bit long mode:
Build identity-mapping page tables in RAM (1 GiB pages for simplicity)
Enable PAE (CR4.PAE) and load the page table base (CR3)
Set the long-mode-enable bit in MSR_EFER
Enable paging (CR0.PG), which activates long mode
Load a 64-bit GDT and perform a far jump to the 64-bit entry point
Why not write this in C? Well, the page tables must be created before enabling 64-bit long mode, but the C code is compiled as 64-bit and cannot execute until long mode is active. Since the setup is just a few store-loops filling PML4 and PDPT entries, assembly is simpler than compiling and linking a separate 32-bit C function just for the page tables.
One subtle requirement emerged during testing with KVM: the GDT used for the mode transition must be in RAM, not ROM. The CPU performs an implicit data read from the GDT during the far jump to load the 64-bit code-segment descriptor. While normal instruction fetches from ROM work fine, KVM cannot service this implicit GDT read from the ROM region (an EPT mapping limitation?). The symptom is a silent hang at the far-jump instruction with no exception or output. The fix is to copy the GDT from ROM to RAM with rep movsl before loading it with lgdt.
SSE: A Hidden Requirement
x86_64 GCC assumes SSE2 is always available (it is part of the x86_64 baseline) and freely generates SSE instructions such as movq %xmm0. If the SSE control bits are not set in the CPU control registers, these instructions cause an invalid-opcode exception (#UD), manifesting as a triple fault and boot loop after relocation.
The startup code must set CR4.OSFXSR and clear CR0.EM before any compiler-generated code runs.
Regparm and Calling Conventions
The x86 32-bit builds use -mregparm=3 to pass function arguments in registers rather than on the stack, improving performance and code size. However, this is a 32-bit-only GCC option and is incompatible with x86_64 (which already uses registers by default per the System V AMD64 ABI). A new Kconfig option (X86_NO_REGPARM) allows disabling this for 32-bit builds. The provides better interoperability with Rust, for example.
The Result
The new qemu-x86_64_nospl board is a single U-Boot binary that boots directly from the QEMU ROM, transitions to 64-bit mode, and can launch an operating system directly or via EFI. It is tested in CI alongside the existing SPL-based configurations. CI tests confirm that it can boot Linux correctly.
To try it with the build-qemu script:
./scripts/build-qemu -a x86 -rsX       # TCG (software emulation)
./scripts/build-qemu -a x86 -rsXk      # KVM (hardware virtualisation)
MSR_FS_BASE for gd pointer — eliminates the writable .data dependency for the global-data pointer on x86_64
Cache gd->relocaddr for EFI — fixes the EFI runtime crash caused by the MSR_FS_BASE change
Build-system changes — restructure 16-bit startup code compilation to support mixed 32/64-bit linking
(continued)
(continued)
(continued)
32-to-64-bit startup code — the assembly that transitions from 32-bit protected mode to 64-bit long mode
New defconfig — qemu-x86_64_nospl board configuration
MTRR setup — enable memory-type range register configuration for the no-SPL path
build-qemu integration — add –no-spl (-X) option to the QEMU helper script
CI coverage — add the new board to the continuous-integration test matrix
Debugging Tips
Debugging early x86 boot code in a virtual machine has its own set of tricks:
QEMU exception logging: qemu-system-x86_64 -d int -D /tmp/log.log logs all CPU exceptions. Search for v=06 (#UD), v=0e (#PF), v=0d (#GP).
Instruction tracing: add -d in_asm to trace executed instructions. Useful for finding where the CPU diverges from the expected path.
KVM limitation: -d int does not work with KVM. Use the QEMU monitor (-monitor telnet:localhost:4444,server,nowait) or serial-port output (outb to 0x3f8) instead.
Identifying SSE faults: look for v=06 (invalid opcode) in the exception log, then decode the instruction bytes (e.g. f3 0f 7e is the SSE movq instruction).
Streamlining U-Boot Workflows: Build and Summarize in One Shot
written by Simon Glass | 6 March 2026
If you use U-Boot’s buildman tool frequently, you are likely familiar with the standard two-step dance. First, you run the build. Then, to really understand what happened—checking for code bloat, size changes, or new warnings—you run buildman -s to generate the summary.
While buildman effectively has two modes (building and summarising), treating them as mutually exclusive steps can be a hassle when you just want a quick health check on a branch.
A new patch aims to smooth out this workflow by adding a Build and Summary option.
The New -z Flag
The patch introduces a new command-line flag: -z (or --build-summary).
Previously, if you wanted to build a branch and immediately see the stats, you had to chain commands. Now, buildman can handle the compilation and immediately transition into generating the summary report within a single execution.
How it works
When you run buildman -z, the tool performs the build as usual. Once the build completes—regardless of whether it succeeded or failed—it automatically invokes the summary logic.
This is particularly useful for quickly iterating on a branch to reduce size growth.
The return code of the command still reflects the success or failure of the build.
Example
To build a branch for a specific board and see the size changes immediately:
buildman -b exph firefly-rk3399 -zSB
This simple addition removes friction from the development cycle, making it easier to keep an eye on binary sizes and warnings as you iterate.
U-Boot CLI Gets a Power-Up: Multi-level Undo/Redo and More
written by Simon Glass | 6 March 2026
Have you ever found yourself wishing for a bit more “modernity” while editing environment variables or command strings at the U-Boot prompt? Our latest patch series brings a suite of enhanced editing features to U-Boot, designed to make the command-line experience much more forgiving and efficient.
While these features improve the standard CLI, they were primarily designed to empower the expo framework, specifically for the new multi-line textedit widget.
Key Features at a Glance
This series introduces several “quality-of-life” improvements that seasoned terminal users will recognize:
Multi-level Undo & Redo: Mistake? No problem. Use Ctrl+Z to undo and Ctrl+Shift+Z to redo.
Emacs-style Yank/Paste: Text deleted with “kill” commands (like Ctrl+K) is saved to a yank buffer and can be pasted back with Ctrl+Y.
Word Navigation: Move quickly through long strings using Ctrl+Left and Ctrl+Right arrows.
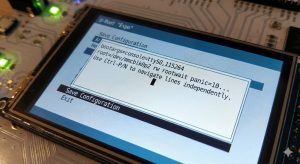
Enhanced Multi-line Support: For expo-based editors, Home and End now intelligently navigate within the current line, and Ctrl+K kills text to the end of the line rather than the entire buffer.
Sandbox SDL Support: We’ve added mapping for Home, End, and Ctrl+arrow keys in the sandbox console for easier testing and development.
Focus on Expo and Graphical Editing
The real star of this update is the integration with expo. We’ve added a new flag, SCENEOF_MULTILINE, which allows the textedit widget to handle multiple lines of text naturally—pressing Enter now inserts a newline rather than closing the widget.
To showcase this, we’ve updated the editenv command. You can now use the -e flag to trigger a graphical environment editor:
=> editenv -e my_long_variable
This opens a dedicated expo scene where you can use all the new undo/redo and navigation features in a clear, multi-line interface.
Configuration (Kconfig Options)
To enable these features in your build, you’ll need to look at these primary Kconfig options:
Option
Description
CONFIG_CMDLINE_EDITOR
The master switch for enhanced editing features. Enabled by default if EXPO is on.
CONFIG_CMDLINE_UNDO
Enables the undo/redo and yank/paste buffers.
CONFIG_CMDLINE_UNDO_COUNT
Configures the depth of the undo ring buffer (Default: 64).
CONFIG_EXPO_EDITENV
Enables the underlying graphical editor logic.
CONFIG_CMD_EDITENV_EXPO
Adds the -e flag to the editenv command to use the expo editor.
Note on Memory: Each undo level stores a full copy of the edit buffer. While 64 levels is the default, you can tune CONFIG_CMDLINE_UNDO_COUNT to fit the memory constraints of your specific board.
Technical Details
The implementation involves a new cli_editor_state structure that manages the redirection of character output and navigation callbacks. This allows the CLI logic to remain clean while supporting the specific needs of a graphical UI like expo. We’ve also addressed several memory leaks in expo object destruction and improved the video test infrastructure to help debug these graphical features more easily.
Improving Text Editing in U-Boot’s Expo: Multiline Support and Cursor Independence
written by Simon Glass | 6 March 2026
As the “Expo” menu system in U-Boot continues to mature, we are moving beyond simple menu selections and into more complex user interaction. One area needing significant attention is text input—specifically, how we handle multi-line text editing and the underlying video console cursor.
In a new 16-patch series, we overhaul the textedit object to support proper multiline editing and fundamentally change how we manage video console contexts.
The Cursor Conflict
Currently, the video console (vidconsole) operates with a single shared context for the cursor state. This works fine for a simple command line, but it becomes problematic when rendering complex UIs. If an Expo object needs to blink a cursor or accept input, it fights for control over the global cursor state. We typically have to rely on a clumsy save/restore mechanism (vidconsole_entry_save) to backup the console state before rendering a menu and restore it afterwards.
This series introduces independent vidconsole contexts.
Now, text-input objects (like textline and textedit) have their own dedicated vidconsole context. They maintain their own cursor position and state, completely independent of the main console or other objects. This allows us to delete the old entry_save and entry_restore mechanisms entirely, resulting in a nice cleanup of the video console drivers.
Multiline Navigation (Ctrl-P / Ctrl-N)
Editing text that spans multiple lines requires more than just moving forward and backward in a character buffer. Users expect to move visually up and down lines while maintaining their horizontal position—standard behaviour in any modern text editor.
We add support for visual line navigation using Ctrl-P (Previous line) and Ctrl-N (Next line).
Implementing this requires some interesting logic. Because the text wraps automatically based on the width of the container, “up” doesn’t mean “back 80 characters.” The implementation uses text measurement to calculate the pixel geometry of the wrapping. When a user moves up or down, we calculate the horizontal pixel offset of the current cursor, find the corresponding visual line, and place the cursor at the character index that matches that pixel alignment.
Key Changes Summary
Independent Contexts: We add vidconsole_ctx to decouple cursor state for different objects.
Cleanup: We remove vidconsole_entry_save/restore ops from console_normal and console_truetype.
Navigation: We add logic to cread_line_process_ch and Expo to handle visual line jumping.
Testing: We include tests in test/boot/expo.c covering keypress handling (Ctrl-B, Ctrl-F, Ctrl-W, etc.) and open/close cycles to ensure the display restores correctly.
This update paves the way for more sophisticated configuration screens within U-Boot, allowing users to edit longer configuration strings, scripts, or certificates directly from the bootloader UI.
Safety at Scale: Introducing check and Per-Commit Validation in pickman
written by Simon Glass | 6 March 2026
Automating cherry-picks with AI (as seen in our introduction to pickman) was a huge step forward for U-Boot Concept maintenance. However, as any maintainer knows, theory and practice often collide when you try to apply 260+ commits in a single session.
After several weeks of real-world use, we’ve identified three “stress points” in large-scale cherry-picking:
The Detail Gap: It’s hard to see if a cherry-pick subtly mangled the code just by looking at a GitLab GUI.
Ghost Commits: Effort is often wasted cherry-picking commits that were already merged via a different path.
Delayed Failure: Building only at the end of a 200-commit series means catching a mistake at commit #5 requires a massive amount of backtracking.
A recent series introduces a suite of safety features to address these challenges.
1. The check Command: Catching “Mangled” Commits
The star of this update is the new check command. It provides a simple, high-level audit of the “delta” between an original commit and its cherry-picked version.
If a cherry-pick results in a significantly different file structure or line count compared to the original, pickman flags it for review:
 Cherry-pick Delta% Original   Subject
 ----------- ------ ---------- -------
 aaea489b2a     100 9bab7d2a7c net: wget: let wget_with_dns work with...
 e005799d8f      33 15e0c5e390 lmb: Remove lmb_alloc_addr_flags()
 c347fb4b1a      41 99145eec2d x86: select CONFIG_64BIT for X86_64
 12 problem commit(s) found
By adding the -d (diff) option, you can see a direct patch-to-patch comparison, making it easy to spot exactly where a conflict resolution went off the rails.
2. Move Fast, Check Often: Per-Commit Validation
We have updated the AI agent prompt to be much more proactive. Instead of blindly applying a series and hoping for the best, the agent now:
Checks Deltas Immediately: After every successful cherry-pick, it compares the new commit stat against the original.
Builds Every Commit: It runs buildman after every single commit. This ensures the tree remains in a “good” state throughout the entire process.
Self-Correction: If a delta is too large (>20%), the agent will now attempt to reset and manually apply the changes using git apply --3way before moving forward.
3. Smarter “Already-Applied” Detection
Duplicate commits are a constant headache. pickman now includes a robust detection system that looks for matching subjects in the target branch (ci/master) before it starts work.
It doesn’t just match text; the agent now compares actual patch content. It will only skip a commit if it can be verified as the same with good confidence, drastically reducing false positives.
Key Commands in this Series
Command
Description
pickman check
Identifies suspect cherry-picks based on delta ratio.
pickman check -d
Shows a source code diff of the patch differences.
pickman check -v
Shows detailed stats for all commits on the current branch.
Quality and Compliance
Beyond features, this series brings the pickman codebase up to production standards. We’ve enforced 80-column compliance, cleared numerous pylint warnings, and transitioned to using Named Tuples (like AgentCommit) to ensure the code is as readable as the commits it manages.
These refinements mark a step along the path to turn pickman from an experimental AI helper into a robust repository maintenance tool.
Introducing Pickman: AI-Powered Cherry-Pick Management for U-Boot
written by Simon Glass | 6 March 2026
Managing cherry-picks across multiple branches is one of the more tedious aspects of maintaining a large project like U-Boot. When you need to backport dozens of commits from an upstream branch while handling merge commits, resolving conflicts, and creating merge requests, the process can consume hours of developer time.
Today we’re introducing pickman, a new tool in the U-Boot Concept tree that automates cherry-pick workflows using AI assistance. Pickman combines database tracking, GitLab integration, and the Claude Agent SDK to transform what was once a manual, error-prone process into a streamlined, largely automated workflow.
The Problem
U-Boot maintainers regularly need to cherry-pick commits from upstream branches (like us/next) to integration branches. This involves:
Identifying which commits haven’t been cherry-picked yet
Handling merge commits that group related changes
Resolving conflicts when commits don’t apply cleanly
Creating merge requests for review
Tracking which commits have been processed
Responding to review comments on merge requests
With hundreds of commits to process, this becomes a significant time investment. Pickman aims to reduce this burden dramatically.
How Pickman Works
Database Tracking
Pickman maintains a local SQLite database (.pickman.db) that tracks:
Source branches being monitored
The last cherry-picked commit for each source
Individual commit status (pending, applied, conflict, skipped)
Merge requests created and their status
Processed review comments
This persistent state allows pickman to resume work across sessions and avoid re-processing commits that have already been handled.
AI-Powered Cherry-Picking
The core innovation in pickman is its use of the Claude Agent SDK to handle the actual cherry-pick operations. When you run pickman apply, the tool:
Identifies the next set of commits to cherry-pick (typically grouped by merge commit)
Creates a new branch for the work
Invokes Claude to perform the cherry-picks
Claude handles any conflicts that arise, using its understanding of the codebase
Records the results in the database
Optionally pushes and creates a GitLab merge request
The AI agent can resolve many common conflicts automatically, understanding context like renamed files, moved code, and API changes. When it encounters something it can’t resolve, it reports the issue clearly.
GitLab Integration
Pickman integrates directly with GitLab to:
Push branches and create merge requests automatically
Monitor MR status (open, merged, closed)
Fetch and process review comments
Update the database when MRs are merged
This creates a closed loop where pickman can operate continuously, creating an MR, waiting for it to be reviewed and merged, then moving on to the next batch of commits.
Getting Started
Prerequisites
# Install the Claude Agent SDK
pip install claude-agent-sdk

# Install the GitLab API library
pip install python-gitlab

# Set up your GitLab token (or use ~/.config/pickman.conf)
export GITLAB_TOKEN="your-token-here"
Basic Usage
# Add a source branch to track
pickman add-source us/next abc123def

# See what commits are pending
pickman next-set us/next

# Apply the next batch of commits
pickman apply us/next --push

# Check comments on open merge requests, taking action as needed
pickman review --remote ci

# Run continuously until stopped
pickman poll us/next --interval 300
Key Commands
Command
Description
add-source
Register a new source branch to track
compare
Show differences between branches
next-set
Preview the next commits to be cherry-picked
apply
Cherry-pick commits using Claude
step
Process merged MRs and create new ones
poll
Run step continuously at an interval
review
Check MRs and handle review comments
count-merges
Show how many merges remain to process
The Workflow in Practice
A typical workflow using pickman looks like this:
# Initial setup - track the upstream branch starting from a known commit
$ pickman add-source us/next e7f94bcbcb0

# See how much work there is
$ pickman count-merges us/next
Found 47 merge commits to process

# Preview what's coming next
$ pickman next-set us/next
Next 3 commits to cherry-pick from us/next:
  - a1b2c3d: arm: Fix cache alignment issue
  - d4e5f6a: drivers: gpio: Add new driver
  - b7c8d9e: Merge "ARM improvements"

# Let pickman handle it
$ pickman apply us/next --push --remote ci --target master
Creating branch cherry-a1b2c3d...
Cherry-picking 3 commits...
Pushing to ci...
Creating merge request...
MR created: https://gitlab.com/project/-/merge_requests/123

# Later, process any review comments and continue
$ pickman poll us/next --remote ci --interval 300
The Human Review Loop
While pickman automates much of the cherry-pick process, human oversight remains central to the workflow. The tool is designed to work alongside maintainers, not replace them. Here’s how the review cycle works:
1. MR Creation
When pickman creates a merge request, it includes a detailed description with the source branch, list of commits, and a conversation log showing how Claude handled the cherry-picks. This gives reviewers full visibility into what happened.
2. Human Review
Maintainers review the MR just like any other contribution. They can:
Examine the diff to verify the cherry-pick is correct
Check that conflicts were resolved appropriately
Request changes by leaving comments on specific lines
Ask questions about why certain decisions were made
3. Automated Comment Handling
When reviewers leave comments, pickman’s review command detects them and invokes Claude to address the feedback:
$ pickman review --remote ci
Found 1 open pickman MR(s):
  !123: [pickman] arm: Fix cache alignment issue
Processing comments for MR !123...
  Comment from maintainer: "This variable name should match the upstream style"
  Addressing comment...
  Pushing updated branch...
Claude reads the comment, understands the requested change, modifies the code accordingly, and pushes an updated branch. The merge-request notes are updated with the new transcript. The database tracks which comments have been processed to avoid duplicate work.
4. Iteration
The review cycle can repeat multiple times. Each time a reviewer adds new comments, running pickman review or pickman poll will detect and address them. This continues until the reviewer is satisfied with the changes.
5. Approval and Merge
Once the maintainer is happy with the MR, he or she approves and merges it through GitLab’s normal interface. Pickman detects the merged status on its next step or poll cycle:
$ pickman step us/next --remote ci --target master
Checking for merged MRs...
  MR !123 has been merged - updating database
  Source us/next: abc123 -> def456
Creating next MR...
  Cherry-picking commits from def456...
  MR created: https://gitlab.com/project/-/merge_requests/124
The database is updated to record the new “last processed” commit, and pickman automatically moves on to the next batch of commits.
The Continuous Loop
With pickman poll, this entire cycle runs continuously:
$ pickman poll us/next --remote ci --target master --interval 300
Polling every 300 seconds (Ctrl+C to stop)...

[09:00] Checking for merged MRs... none found
[09:00] Checking for review comments... none found
[09:00] Open MR !123 pending review
[09:00] Sleeping 300 seconds...

[09:05] Checking for merged MRs... none found
[09:05] Checking for review comments... 2 new comments on !123
[09:05] Addressing comments...
[09:05] Pushed updates to MR !123
[09:05] Sleeping 300 seconds...

[09:10] Checking for merged MRs... !123 merged!
[09:10] Updated database: us/next now at def456
[09:10] Creating new MR for next commits...
[09:10] MR !124 created
[09:10] Sleeping 300 seconds...
The maintainer simply reviews each MR as it appears, adds comments when needed, and merges when satisfied. Pickman handles everything else automatically, creating a smooth continuous integration pipeline for cherry-picks. If manual intervention is needed, you can typically just make some edits and push an update to the branch.
Handling Merge Commits
One of pickman’s key features is intelligent handling of merge commits. Rather than cherry-picking merge commits directly (which often fails), pickman identifies the individual commits within a merge and processes them as a group. This ensures that related changes stay together in a single merge request.
The tool follows the first-parent chain to identify merge boundaries, which matches the typical workflow of merging topic branches into the main development branch.
History Tracking
Pickman maintains a .pickman-history file in the repo that records each cherry-pick operation, including:
Date and source branch
Branch name created
List of commits processed
The full conversation log with Claude
This provides an audit trail and helps with debugging when things don’t go as expected.
Future Directions
Pickman is an experimental tool. We will use the next few months to refine it and learn how best to envolve it.
Try It Out
Pickman is available in the U-Boot Concept tree under tools/pickman/. To run the tests:
$ ./tools/pickman/pickman test
We welcome feedback and contributions. If you maintain a branch that requires regular cherry-picks from upstream, give pickman a try and let us know how it works for your workflow.
Pickman was developed with significant assistance from Claude (Anthropic’s AI assistant) for both the implementation and the cherry-pick automation itself.
The Best of Both Worlds: Hybrid Python/C Testing in U-Boot
written by Simon Glass | 6 March 2026
U-Boot has two testing worlds that rarely meet. Python tests are flexible and can set up complex scenarios – disk images, network configurations, boot environments. C tests are fast, debuggable, and run directly on hardware. What if we could combine them?
The Problem
Consider filesystem testing. You need to:
Create a disk image with specific files
Calculate MD5 checksums for verification
Mount it in U-Boot
Run read/write operations
Verify the results
The Python test framework handles steps 1-2 beautifully. But the actual test logic in Python looks like this:
output = ubman.run_command(f'{cmd}load host 0:0 {addr} /{filename}')
assert 'complete' in output
output = ubman.run_command(f'md5sum {addr} {hex(size)}')
assert expected_md5 in output
String parsing. Hoping the output format doesn’t change. No stepping through with a debugger when it fails (well actually it is possible, but it requires gdbserver). And try running this on real hardware without a console connection.
The Solution: Pass Arguments to C
What if Python could call a C test with parameters?
The Python test is now 4 lines. The C test has real assertions and can easily be debugged.
The Private Buffer
Tests often need temporary storage – paths, formatted strings, intermediate results. Rather than allocating memory or using globals, each test gets a 256-byte private buffer:
static int my_test(struct unit_test_state *uts)
{
    // Build a path using the private buffer
    snprintf(uts->priv, sizeof(uts->priv), "/%s/%s", dir, filename);

    ut_assertok(fs_read(uts->priv, addr, 0, 0, &size));

    return 0;
}
No cleanup needed. The buffer is part of unit_test_state and exists for the life of each test.
Why Not Just Write Everything in C?
You could. But consider:
Creating a 2.5GB sparse file with specific content: Python’s os and subprocess modules make this trivial
This infrastructure was developed to convert U-Boot’s filesystem tests from pure Python to a hybrid model. The Python setup remains, but the test logic now lives in debuggable, portable C code.
When -858993444 Tests Run: A Tale of Linker Lists and Magic Numbers
written by Simon Glass | 6 March 2026
Have you ever seen output like this from your test suite?
Running -858993444 bloblist tests
That’s not a buffer overflow or memory corruption. It’s a wierd interaction between linker alignment, compiler optimisations, and pointer arithmetic. Let me tell you how we tracked it down.
The Mystery
U-Boot uses ‘linker lists’ extensively – a pattern where the linker collects scattered data structures into contiguous arrays. Drivers, commands, and unit tests all use this mechanism. Each list has start (_1) and end (_3) markers, with entries (_2_*) in between.
Simple, right? The compiler divides the byte span by sizeof(struct) to get the count. Except sometimes it returns garbage.
The Clue: 0xCCCCCCCC
That -858993444 value caught my eye. In hex, it’s 0xCCCCCCCC – a suspiciously regular pattern. This isn’t random memory; it’s the result of a calculation.
GCC optimizes division by constants using multiplicative inverses. Instead of expensive division, it multiplies by a “magic number” and shifts. For dividing by 40 (a typical struct size), GCC generates something like:
movl    %eax, %edx
imulq   $-858993459, %rdx    ; magic number for /40
shrq    $34, %rdx
This optimization is mathematically correct – but only when the dividend is an exact multiple of the divisor. When it’s not, you get rubbish.
The Root Cause
U-Boot’s CONFIG_LINKER_LIST_ALIGN (32 bytes on sandbox) aligns each list’s start. But here’s the subtle bug: the end marker was also being aligned:
When the next list in memory has a higher alignment requirement, the linker inserts padding before our end marker. Our list might have 15 entries of 40 bytes each (600 bytes), but the span from start to end becomes 608 bytes due to padding.
608 / 40 = 15.2
Feed 608 into GCC’s magic-number division for 40, and out comes 0xCCCCCCCC.
The Fix
Change the end marker alignment to 1:
static char end[0] __aligned(1) // No padding before end marker
Now the end marker sits immediately after the last entry, the span is an exact multiple, and pointer arithmetic works correctly.
Detection
We enhanced our check_linker_lists.py script to catch this:
Gap analysis: Compare gaps between consecutive symbols. Inconsistent gaps mean padding was inserted within the list.
Size comparison: Using nm -S to get symbol sizes, we check if gap > size. If so, padding exists.
Span verification: Check if (end - start) is a multiple of struct size. If not, pointer subtraction will fail.
./scripts/check_linker_lists.py u-boot -v
Lessons Learned
Magic number division is fragile: It only works for exact multiples. Any padding breaks it silently.
Zero-size markers inherit alignment from neighbours: The linker places them at aligned boundaries based on what follows.
Pointer arithmetic assumes contiguous arrays: This assumption is violated when padding sneaks in.
Garbage values often have patterns: 0xCCCCCCCC isn’t random – it’s a clue pointing to failed arithmetic.
The fix was one line. Finding it took considerably longer, but that’s firmware development for you.
This bug was found while working on U-Boot’s unit test infrastructure. The fix is in the patch “linker_lists: Fix end-marker alignment to prevent padding”.
The Silent Saboteurs: Detecting and Resolving malloc() Failures in U-Boot
written by Simon Glass | 6 March 2026
The robust operation of any complex software system, especially one as foundational as U-Boot, hinges on the reliability of its core services. Among these, dynamic memory allocation via malloc() is paramount. While often taken for granted, failures in malloc() can be silent saboteurs, leading to unpredictable behaviour, security vulnerabilities, or outright system crashes. Here, we delve into the mechanisms for detecting and resolving these subtle yet critical issues, ensuring the integrity of U-Boot’s memory management.
The background for this topic is a recent series in Concept, which aims to improve tools and reliability in this area. It builds on the recent update to dlmalloc.
The Challenge of Dynamic Memory
In the constrained environment of an embedded bootloader, where resources are often tight and determinism is key, malloc() failures present unique challenges:
Subtlety: A failed malloc() call doesn’t always immediately manifest as a crash. It might return NULL, and if not meticulously checked, subsequent operations on this NULL pointer can lead to memory corruption, double-frees, or use-after-free vulnerabilities much later in execution.
Asynchronicity: With the use of the ‘cyclic’ feature, memory allocation can become a race condition, exacerbating the difficulty of reproducing and debugging issues.
Heap Fragmentation: Long-running systems or complex sequences of allocations and deallocations can lead to heap fragmentation, where sufficient total memory exists, but no contiguous block is large enough for a requested allocation. This is particularly insidious as it’s not a memory exhaustion issue per se, but an allocation-strategy issue.
Debugging Overhead: Traditional heap debugging tools can themselves consume significant memory and execution time, making them impractical for a bootloader.
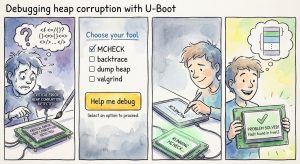
Proactive Detection: The New Toolkit 🛠️
A new series in Concept introduces powerful new instrumentation and commands, moving U-Boot toward best-in-class memory debugging capabilities.
1. Real-Time Heap Statistics (malloc info)
The new malloc info command provides a clear, instantaneous snapshot of the heap’s health and usage patterns:
Statistic
Description
total bytes
Total size of the malloc() heap (set by CONFIG_SYS_MALLOC_LEN).
in use bytes
Current memory allocated and held by the application.
malloc count
Total number of calls to malloc().
free count
Total number of calls to free().
realloc count
Total number of calls to realloc().
This information is helpful for quickly identifying memory leaks (high malloc count with low/stagnant free count) or excessive memory churn (high total counts).
2. Caller Tracking and Heap Walk (malloc dump)
When enabled via CONFIG_MCHECK_HEAP_PROTECTION, the malloc dump command becomes the most potent debugging tool:
Heap Walk: It systematically walks the entire heap, printing the address, size, and status (used or free) of every memory chunk.
Allocation Traceability: For every allocated chunk, the header now stores a condensed backtrace string, showing the function and line number of the code that requested the memory:
Post-free() Analysis: This caller information is also preserved in the metadata of freed chunks. This is invaluable for detecting memory leaks, as you can see precisely which function allocated a chunk that is now free, or identifying potential double-free sources. Of course, free blocks can be reused, so this isn’t a panacea.
3. Heap Protection (mcheck)
The integration of the mcheck heap-protection feature embeds ‘canary’ data before and after each allocated chunk.
Boundary Checking: These canaries are checked on free() and during heap walks. If a canary is corrupted, it instantly signals a buffer overflow or buffer underflow—a classic symptom of heap corruption.
Detection: This shifts the memory integrity issue from a mysterious crash hours later to an immediate, localized fault, dramatically speeding up remediation.
How This Series Helps U-Boot Development
Note: Some of these features are currently largely available only on sandbox, U-Boot’s development and testing environment. In particular, there is currently no way to obtain line-number information at runtime on other architectures.
Overall, this series represents a qualitative shift in U-Boot’s memory diagnostics, providing a mechanism for detecting and finding the root cause of subtle memory bugs that were previously nearly impossible to find.
Pinpointing Leaks (Performance & Stability): Before this series, finding a memory leak was a slow process of elimination. Now, a simple malloc dump reveals which functions are responsible for the largest or most persistent allocated chunks, directly mapping resource usage to the source code (log_init:453 or membuf_new:420).
Tracking Heap Corruption (Reliability): Heap corruption is often caused by writing beyond the boundaries of an allocated buffer. With mcheck, this corruption is immediately detected. Furthermore, the malloc dump allows developers to see the call site of the corrupted chunk, leading you straight to the faulty allocation rather than searching half the code base.
Enabling Backtrace for Debugging: The series includes a refactor of the backtrace feature, ensuring that it no longer relies on malloc(). This guarantees that backtraces can be collected safely even when the allocator itself is in a compromised state (e.g., during an mcheck failure or stack smash), providing reliable context for crash reports.
Early results
This work has already yielded results. A huge memory leak involving the SCMI was discovered simply by looking at the malloc dump. A watchdog crash with ‘ut dm’ was pinpointed. Also it uncovered the very large number of allocations performed by the Truetype font engine, leading to a simple optimisation to reduce strain on the heap.
With this series U-Boot establishes the strong base for foundational diagnostics, transforming the challenge of memory debugging in a constrained environment into a manageable, data-driven process.