Cleaning Up ext4l: Organizing the Compatibility Layer

We’ve been working to improve the structure of the ext4l filesystem implementation in U-Boot, specifically targeting the large compatibility layer that allows us to reuse Linux kernel code.
We’ve just posted a new 33-patch series that reorganises the compatibility stubs, moving them out of the monolithic ext4_uboot.h and into their proper locations within include/linux/.
The Problem: A Monolithic Header
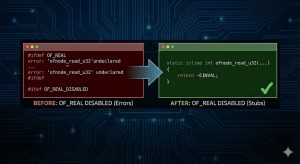
The ext4l filesystem uses a file named ext4_uboot.h to bridge the gap between U-Boot’s environment and the Linux kernel code it incorporates. To save time when porting ext4l, this header has become a dumping ground for every missing function, macro, and struct definition needed to make the code compile. It contains stubs for everything from inode operations to block device management, all mixed together.
This monolithic approach makes it difficult to see what was actually being stubbed and prevented other subsystems from using these compatibility definitions.
So why did we do it this way?
The header file has only been there a few months. Why didn’t we just put everything in the right place to begin with?
Well, it sounds easy, but actually it’s quite tricky. When porting ext4l there were thousands upon thousands of build errors and warnings. We could have brought in the Linux files one by one to try to get past the compilation step, i.e. to just be left with link errors. But the files continue a lot of stuff we don’t need in U-Boot, so that would have created lots of useless code to maintain.
Worse, most of that code would just add confusion, since there is no C implementation. Someone coming along later would see the prototype, call the function and wonder why it doesn’t work.
But the main issue was that the goal is to make the filesystem actually work. Until something is working, any stubbing or implementation work is speculative. The necessary pieces only fall into place when it is possible to mount a file system, list a directory, write to a file, etc.
So the approach chosen was to pull in, function by function, macro by macro, only what was needed to make the code build. This was still many weeks of work, not to mention around a week of time with Google Antimatter and Claude Code to build the initial prototype.
So ext4_uboot.h provided a feasible path to a functional implementation. The problem is, now we have an ext4_uboot.h hangover.
The Solution: Standard Linux Headers
This series takes a systematic approach to cleaning up this technical debt, building on half a dozen earlier series of a similar ilk. We move definitions from ext4_uboot.h to their standard Linux header locations in include/linux/
For example:
- File and inode operations (
struct file_operations,struct inode_operations) are now inlinux/fs.h - Block device operations (
blkdev_issue_discard, etc.) are now inlinux/blkdev.h - Wait queue primitives (
DEFINE_WAIT) are inlinux/wait.h - DAX stubs are in
linux/dax.h
We also created new headers where necessary, such as include/linux/fs/super_types.h for superblock operations, mirroring the kernel’s structure more closely.
Fixing list_sort
One notable fix in this series involves list_sort(). The function signature in U-Boot didn’t match the Linux kernel, lacking const qualifiers on the list heads in the comparison callback.
We updated list_sort() to match the kernel API:
typedef int (*list_cmp_func_t)(void *priv, const struct list_head *a,
                               const struct list_head *b);
This requires updating several callers across the codebase (UBIFS, EFI loader, STM32MP), but it ensures that we can use kernel code that relies on list_sort without modification.
Results
The result is a significant reduction in the size and complexity of ext4_uboot.h, shrinking it from over 550 lines to around 270 lines of essential, ext4-specific glue (at its peak the file held over 3000 lines!). The remaining code is much cleaner, with stubs residing where developers expect to find them.
This work completes the reorganisation of the ext4l compatibility layer, making future updates and maintenance significantly easier.