The Best of Both Worlds: Hybrid Python/C Testing in U-Boot

U-Boot has two testing worlds that rarely meet. Python tests are flexible and can set up complex scenarios – disk images, network configurations, boot environments. C tests are fast, debuggable, and run directly on hardware. What if we could combine them?

The Problem

Consider filesystem testing. You need to:

  1. Create a disk image with specific files
  2. Calculate MD5 checksums for verification
  3. Mount it in U-Boot
  4. Run read/write operations
  5. Verify the results

The Python test framework handles steps 1-2 beautifully. But the actual test logic in Python looks like this:

output = ubman.run_command(f'{cmd}load host 0:0 {addr} /{filename}')
assert 'complete' in output
output = ubman.run_command(f'md5sum {addr} {hex(size)}')
assert expected_md5 in output

String parsing. Hoping the output format doesn’t change. No stepping through with a debugger when it fails (well actually it is possible, but it requires gdbserver). And try running this on real hardware without a console connection.

The Solution: Pass Arguments to C

What if Python could call a C test with parameters?

cmd = f'ut -f fs fs_test_load_norun fs_type={fs_type} fs_image={path} md5={expected}'
ubman.run_command(cmd)

And in C:

static int fs_test_load_norun(struct unit_test_state *uts)
{
    const char *fs_type = ut_str(0);
    const char *fs_image = ut_str(1);
    const char *expected_md5 = ut_str(2);

    ut_assertok(fs_set_blk_dev("host", "0", fs_type));
    ut_assertok(fs_read("/testfile", addr, 0, 0, &actread));
    ut_assertok(verify_md5(uts, expected_md5));

    return 0;
}

Real assertions. Real debugging. Real portability.

How It Works

1. Declare Arguments with Types

UNIT_TEST_ARGS(fs_test_load_norun, UTF_CONSOLE | UTF_MANUAL, fs,
               { "fs_type", UT_ARG_STR },
               { "fs_image", UT_ARG_STR },
               { "md5", UT_ARG_STR });

The UNIT_TEST_ARGS macro creates the test with argument definitions. Each argument has a name and type (UT_ARG_STR or UT_ARG_INT).

2. Parse on the Command Line

=> ut -f fs fs_test_load_norun fs_type=ext4 fs_image=/tmp/test.img md5=abc123

The ut command parses name=value pairs and populates uts->args[].

3. Access in C

const char *fs_type = uts->args[0].vstr;    // String access
int count = uts->args[1].vint;              // Integer access

Arguments are accessed by index in declaration order.

A Real Example: Filesystem Tests

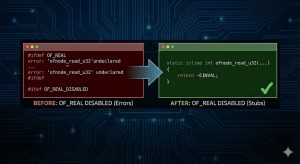
Here’s the before and after for a filesystem size test.

Before (Pure Python):

def test_fs3(self, ubman, fs_obj_basic):
    fs_type, fs_img, _ = fs_obj_basic
    ubman.run_command(f'host bind 0 {fs_img}')
    output = ubman.run_command(f'{fs_type}size host 0:0 /{BIG_FILE}')
    ubman.run_command('printenv filesize')
    # Parse output, check values, hope nothing changed...

After (Hybrid):

def test_fs3(self, ubman, fs_obj_basic):
    fs_type, fs_img, _ = fs_obj_basic
    assert run_c_test(ubman, fs_type, fs_img, 'fs_test_size_big',
                      big=BIG_FILE)
static int fs_test_size_big_norun(struct unit_test_state *uts)
{
    const char *big = ut_str(2);
    loff_t size;

    ut_assertok(fs_size(big, &size));
    ut_asserteq_64((loff_t)SZ_1M * 2500, size);

    return 0;
}

The Python test is now 4 lines. The C test has real assertions and can easily be debugged.

The Private Buffer

Tests often need temporary storage – paths, formatted strings, intermediate results. Rather than allocating memory or using globals, each test gets a 256-byte private buffer:

static int my_test(struct unit_test_state *uts)
{
    // Build a path using the private buffer
    snprintf(uts->priv, sizeof(uts->priv), "/%s/%s", dir, filename);

    ut_assertok(fs_read(uts->priv, addr, 0, 0, &size));

    return 0;
}

No cleanup needed. The buffer is part of unit_test_state and exists for the life of each test.

Why Not Just Write Everything in C?

You could. But consider:

  • Creating a 2.5GB sparse file with specific content: Python’s os and subprocess modules make this trivial
  • Calculating MD5 checksums: One line in Python
  • Setting up complex boot environments: Python’s pytest fixtures handle dependencies elegantly
  • Parameterized tests: pytest’s @pytest.mark.parametrize runs the same test across ext4, FAT, exFAT automatically

The hybrid approach uses each language for what it does best.

Why Not Just Write Everything in Python?

  • Debugging: GDB beats print statements
  • Hardware testing: C tests run on real boards (and sandbox) without console parsing
  • Speed: No string-parsing overhead; less back-and-forth across the Python->U-Boot console
  • Assertionsut_asserteq() gives precise failure locations
  • Code coverage: C tests contribute to coverage metrics (once we get them!)

Getting Started

1. Declare your test with arguments:

static int my_test_norun(struct unit_test_state *uts)
{
    const char *input = ut_str(0);
    int expected = ut_int(1);

    // Your test logic here
    ut_asserteq(expected, some_function(input));

    return 0;
}
UNIT_TEST_ARGS(my_test_norun, UTF_CONSOLE | UTF_MANUAL, my_suite,
               { "input", UT_ARG_STR },
               { "expected", UT_ARG_INT });

2. Call from Python:

def test_something(self, ubman):
    ubman.run_command(f'ut -f my_suite my_test_norun input={value} expected={result}')

3. Check the result:

    output = ubman.run_command('echo $?')
    assert output.strip() == '0'

The Documentation

Full details are in the documentation. The filesystem tests in test/fs/fs_basic.c and test/py/tests/test_fs/test_basic.py serve as a complete working example.

This infrastructure was developed to convert U-Boot’s filesystem tests from pure Python to a hybrid model. The Python setup remains, but the test logic now lives in debuggable, portable C code.


When -858993444 Tests Run: A Tale of Linker Lists and Magic Numbers

Have you ever seen output like this from your test suite?

Running -858993444 bloblist tests

That’s not a buffer overflow or memory corruption. It’s a wierd interaction between linker alignment, compiler optimisations, and pointer arithmetic. Let me tell you how we tracked it down.

The Mystery

U-Boot uses ‘linker lists’ extensively – a pattern where the linker collects scattered data structures into contiguous arrays. Drivers, commands, and unit tests all use this mechanism. Each list has start (_1) and end (_3) markers, with entries (_2_*) in between.

To count entries, we use pointer subtraction:

#define ll_entry_count(_type, _list) \
    (ll_entry_end(_type, _list) - ll_entry_start(_type, _list))

Simple, right? The compiler divides the byte span by sizeof(struct) to get the count. Except sometimes it returns garbage.

The Clue: 0xCCCCCCCC

That -858993444 value caught my eye. In hex, it’s 0xCCCCCCCC – a suspiciously regular pattern. This isn’t random memory; it’s the result of a calculation.

GCC optimizes division by constants using multiplicative inverses. Instead of expensive division, it multiplies by a “magic number” and shifts. For dividing by 40 (a typical struct size), GCC generates something like:

movl    %eax, %edx
imulq   $-858993459, %rdx    ; magic number for /40
shrq    $34, %rdx

This optimization is mathematically correct – but only when the dividend is an exact multiple of the divisor. When it’s not, you get rubbish.

The Root Cause

U-Boot’s CONFIG_LINKER_LIST_ALIGN (32 bytes on sandbox) aligns each list’s start. But here’s the subtle bug: the end marker was also being aligned:

#define ll_entry_end(_type, _list)                    \
({                                                    \
    static char end[0] __aligned(32)                   \  // <-- Problem!
        __attribute__((used))                         \
        __section(".u_boot_list_"#_list"_3");         \
    (_type *)&end;                                    \
})

When the next list in memory has a higher alignment requirement, the linker inserts padding before our end marker. Our list might have 15 entries of 40 bytes each (600 bytes), but the span from start to end becomes 608 bytes due to padding.

608 / 40 = 15.2

Feed 608 into GCC’s magic-number division for 40, and out comes 0xCCCCCCCC.

The Fix

Change the end marker alignment to 1:

static char end[0] __aligned(1)  // No padding before end marker

Now the end marker sits immediately after the last entry, the span is an exact multiple, and pointer arithmetic works correctly.

Detection

We enhanced our check_linker_lists.py script to catch this:

  1. Gap analysis: Compare gaps between consecutive symbols. Inconsistent gaps mean padding was inserted within the list.
  2. Size comparison: Using nm -S to get symbol sizes, we check if gap > size. If so, padding exists.
  3. Span verification: Check if (end - start) is a multiple of struct size. If not, pointer subtraction will fail.
./scripts/check_linker_lists.py u-boot -v

Lessons Learned

  1. Magic number division is fragile: It only works for exact multiples. Any padding breaks it silently.
  2. Zero-size markers inherit alignment from neighbours: The linker places them at aligned boundaries based on what follows.
  3. Pointer arithmetic assumes contiguous arrays: This assumption is violated when padding sneaks in.
  4. Garbage values often have patterns0xCCCCCCCC isn’t random – it’s a clue pointing to failed arithmetic.

The fix was one line. Finding it took considerably longer, but that’s firmware development for you.

This bug was found while working on U-Boot’s unit test infrastructure. The fix is in the patch “linker_lists: Fix end-marker alignment to prevent padding”.


The Silent Saboteurs: Detecting and Resolving malloc() Failures in U-Boot

The robust operation of any complex software system, especially one as foundational as U-Boot, hinges on the reliability of its core services. Among these, dynamic memory allocation via malloc() is paramount. While often taken for granted, failures in malloc() can be silent saboteurs, leading to unpredictable behaviour, security vulnerabilities, or outright system crashes. Here, we delve into the mechanisms for detecting and resolving these subtle yet critical issues, ensuring the integrity of U-Boot’s memory management.

The background for this topic is a recent series in Concept, which aims to improve tools and reliability in this area. It builds on the recent update to dlmalloc.

The Challenge of Dynamic Memory

In the constrained environment of an embedded bootloader, where resources are often tight and determinism is key, malloc() failures present unique challenges:

  1. Subtlety: A failed malloc() call doesn’t always immediately manifest as a crash. It might return NULL, and if not meticulously checked, subsequent operations on this NULL pointer can lead to memory corruption, double-frees, or use-after-free vulnerabilities much later in execution.
  2. Asynchronicity: With the use of the ‘cyclic’ feature, memory allocation can become a race condition, exacerbating the difficulty of reproducing and debugging issues.
  3. Heap Fragmentation: Long-running systems or complex sequences of allocations and deallocations can lead to heap fragmentation, where sufficient total memory exists, but no contiguous block is large enough for a requested allocation. This is particularly insidious as it’s not a memory exhaustion issue per se, but an allocation-strategy issue.
  4. Debugging Overhead: Traditional heap debugging tools can themselves consume significant memory and execution time, making them impractical for a bootloader.

Proactive Detection: The New Toolkit 🛠️

A new series in Concept introduces powerful new instrumentation and commands, moving U-Boot toward best-in-class memory debugging capabilities.

1. Real-Time Heap Statistics (malloc info)

The new malloc info command provides a clear, instantaneous snapshot of the heap’s health and usage patterns:

Statistic Description
total bytes Total size of the malloc() heap (set by CONFIG_SYS_MALLOC_LEN).
in use bytes Current memory allocated and held by the application.
malloc count Total number of calls to malloc().
free count Total number of calls to free().
realloc count Total number of calls to realloc().

This information is helpful for quickly identifying memory leaks (high malloc count with low/stagnant free count) or excessive memory churn (high total counts).

2. Caller Tracking and Heap Walk (malloc dump)

When enabled via CONFIG_MCHECK_HEAP_PROTECTION, the malloc dump command becomes the most potent debugging tool:

  • Heap Walk: It systematically walks the entire heap, printing the address, size, and status (used or free) of every memory chunk.
  • Allocation Traceability: For every allocated chunk, the header now stores a condensed backtrace string, showing the function and line number of the code that requested the memory:

    • 19a0e010   a0       log_init:453 <-board_init_r:774 <-sandbox_flow:

  • Post-free() Analysis: This caller information is also preserved in the metadata of freed chunks. This is invaluable for detecting memory leaks, as you can see precisely which function allocated a chunk that is now free, or identifying potential double-free sources. Of course, free blocks can be reused, so this isn’t a panacea.

3. Heap Protection (mcheck)

The integration of the mcheck heap-protection feature embeds ‘canary’ data before and after each allocated chunk.

  • Boundary Checking: These canaries are checked on free() and during heap walks. If a canary is corrupted, it instantly signals a buffer overflow or buffer underflow—a classic symptom of heap corruption.
  • Detection: This shifts the memory integrity issue from a mysterious crash hours later to an immediate, localized fault, dramatically speeding up remediation.

How This Series Helps U-Boot Development

Note: Some of these features are currently largely available only on sandbox, U-Boot’s development and testing environment. In particular, there is currently no way to obtain line-number information at runtime on other architectures.

Overall, this series represents a qualitative shift in U-Boot’s memory diagnostics, providing a mechanism for detecting and finding the root cause of subtle memory bugs that were previously nearly impossible to find.

  1. Pinpointing Leaks (Performance & Stability): Before this series, finding a memory leak was a slow process of elimination. Now, a simple malloc dump reveals which functions are responsible for the largest or most persistent allocated chunks, directly mapping resource usage to the source code (log_init:453 or membuf_new:420).
  2. Tracking Heap Corruption (Reliability): Heap corruption is often caused by writing beyond the boundaries of an allocated buffer. With mcheck, this corruption is immediately detected. Furthermore, the malloc dump allows developers to see the call site of the corrupted chunk, leading you straight to the faulty allocation rather than searching half the code base.
  3. Enabling Backtrace for Debugging: The series includes a refactor of the backtrace feature, ensuring that it no longer relies on malloc(). This guarantees that backtraces can be collected safely even when the allocator itself is in a compromised state (e.g., during an mcheck failure or stack smash), providing reliable context for crash reports.

Early results

This work has already yielded results. A huge memory leak involving the SCMI was discovered simply by looking at the malloc dump. A watchdog crash with ‘ut dm’ was pinpointed. Also it uncovered the very large number of allocations performed by the Truetype font engine, leading to a simple optimisation to reduce strain on the heap.

With this series U-Boot establishes the strong base for foundational diagnostics, transforming the challenge of memory debugging in a constrained environment into a manageable, data-driven process.


🔑 Full Circle: Completing TKey Hardware-Backed LUKS Unlock

This final series in Concept closes out the complete implementation of TKey hardware-backed full disk encryption (FDE) in U-Boot.

The previous series established the core logic and UI flow. This final work wraps up the effort by providing end-to-end testing, a useful Python tool for key management on the host, along with documentation, making the feature ready for real-world secure-boot environments.


🛠️ The Final Pieces of the Puzzle

This series of 7 patches focuses on robust testing, external utility, and documentation.

1. Host-Side Key Management Tool

The core of this series is the new script, scripts/tkey_fde_key.py.

  • Key Derivation: This script allows users on their host machine to use a physical TKey and a passphrase to derive the exact same disk encryption key that U-Boot derives at boot time.
  • Disk Operations: It is an all-in-one utility that can then use the derived key to:

    • Encrypt a disk image (or partition) with LUKS.
    • Open/Unlock an already encrypted disk image for host access.
    • This capability is essential for creating encrypted root filesystems that U-Boot can later unlock using the TKey.

2. Comprehensive Testing & Infrastructure

To ensure this complex hardware-backed flow is reliable, the test infrastructure has been significantly upgraded:

  • Full TKey Unlock Test: A major test, bootctl_logic_tkey, validates the entire TKey unlock state machine: passphrase entry, handling TKey removal and re-insertion prompts, app loading, key derivation, and final LUKS partition unlock.
  • New Test Devices: The series adds two new disk images to the sandbox:

    • mmc13: A LUKS2-encrypted disk designed specifically for TKey-based unlock.
    • mmc14: A LUKS2-encrypted disk for testing the pre-derived master key path (via the -p flag in luks unlock), ensuring maximum flexibility.

  • Keyfile Support: The Python filesystem helper is updated to support key files (instead of only passphrases) and the ability to specify a raw master key. This allows the automated tests to encrypt disks using the deterministic key generated by the TKey emulator.

3. Complete Documentation

The final piece is the doc/usage/tkey-fde.rst guide, which ties the entire workflow together.

  • Workflow Explained: This new documentation covers the entire TKey FDE workflow, from how the key is derived from the User-Supplied Secret (USS) and the TKey’s Unique Device Identifier (UDI), to using the tkey_fde_key.py script and configuring U-Boot.
  • Physical TKey Testing: It includes a guide on how to use a real TKey for testing by generating an override.bin key, allowing developers to switch seamlessly between the emulator and physical hardware.

What’s next?

This work has been an interesting expedition into LUKS and hardware-backed security. While it is complete from the U-Boot side, there are a few loose ends which could be looked at in future. For example, it would be useful to communicate the unlock key to Linux’s the ramdisk environment, so it doesn’t need to do another unlock (and prompt the user) on startup.

In any case, U-Boot now includes a complete, robust, and well-documented solution for hardware-backed full disk encryption, a significant step forward in the area of security.


🔒 TKey Integration: Unlocking Encrypted Disks

A new series in Concept introduces the complete logic and UI enhancements required to use a TKey to unlock an encrypted disk (like a LUKS partition) before booting an operating system.

1. The TKey Unlock Flow

The TKey unlock process is complex because it involves iterative communication with the external hardware and handling scenarios like the TKey being in the wrong mode:

  • State Machine: The series implements a simple state machine (using enum unlock_state) to manage the entire TKey process. This allows the UI to remain responsive while waiting for user input, TKey removal, TKey insertion, or the app loading process .
  • App Loading: The user’s passphrase is used as the User-Supplied Secret (USS) to load a signing app onto the TKey. This is done incrementally (tkey_load_next) on each UI poll to prevent the UI from freezing.
  • Key Derivation: Once the app is loaded, the TKey’s public key is used to derive the disk encryption key (via SHA256 hashing), which is then used to unlock the LUKS partition.

2. UI and UX Enhancements

The user interface has been significantly upgraded to support this secure flow:

  • Visual Indicators: The series adds a lock image which appears next to any encrypted OS entry in the Bootctl UI, providing immediate visual feedback.
  • Passphrase Prompt: A dedicated textline object is provided for the user to enter their passphrase/USS. The series ensures this text renders as asterisks (by setting the SCENEOF_PASSWORD flag) for security.
  • User Messaging: The UI is enhanced to display dynamic messages to the user:

    • “Unlocking…” or “Preparing TKey… 50%” (progress updates during app load).
    • Error messages like “Incorrect passphrase.”
    • Hardware prompts like “Please remove TKey” or “Please insert TKey.”

  • Autonomy: The series provides functions (bc_ui_show_pass, bc_ui_get_pass, etc.) to allow the core logic to control the visibility and content of the passphrase and message fields.

3. Stability and Testing

  • LUKS2 Support: The logic is updated to ensure compatibility with LUKS2 partitions, which is crucial for modern Linux distributions.
  • TKey Correction: A fix is included in the TKey driver logic to correctly handle the position and use of the USS hash during app loading.
  • Test Environment: The series enables the Bootctl tests and includes configuration to use a TKey emulator within the Sandbox environment, ensuring the new TKey logic remains functional in the future.
  • luks command enhancement: The luks unlock command gains a new -p flag, allowing a pre-derived master key to be passed, which is useful for testing or integration with external key management systems.

This series moves U-Boot’s Bootctl from simple boot selection toward a feature-rich, hardware-backed security manager, making it a viable candidate for handling encrypted system boots.


🚀 Typing in Expo Menus

A new series just landed, focussed on making one part of U-Boot’s new graphical menus (Expo) considerably better with non-popup menus.

A long-standing and annoying limitation in expo is that couldn’t really type into text fields (like for passwords) if the menu wasn’t a pop-up (i.e. as used by the ‘cedit’ configuration editor). Now, with this work, you can actually use your keyboard!


The Highlights

1. The Series Enables Input! ⌨️

  • When a text box is highlighted, key presses are correctly routed to the textline object. This is important for things like password or configuration fields embedded in a menu.
  • No More Ghost Text: The series fixes a bug where the displayed text wouldn’t update visually because the text object was pointing at a static empty string instead of the textline’s live buffer. That’s squashed now—what gets typed is what shows up!

2. A Crazy Key Conflict is Resolved 🤯

  • It turns out, pressing Up Arrow and hitting the Backspace/Delete Character shortcut (Ctrl-B) were sending the exact same signal to U-Boot. Messy!
  • The Fix: This series moves the menu navigation keys to a different number range (0x100). Now, the system knows the difference between “move up” and “delete a character,” so everything works as it should!

3. Debugging is Easier Now (For the Devs) 🔍

  • No More Silent-Mode Hassle: The series adds a new test flag (UTF_NO_SILENT) for tests that need the console to be active. This is vital for text-entry tests, as console rendering must be on for the textline state to update correctly.
  • Better Names: The series makes the names of all the menu objects clearer (e.g., item0.label instead of a generic label). This hierarchical naming significantly simplifies tracing objects during debugging, particularly when dumping the expo.
  • More Docs: New documentation covers how to write tests and debug the Expo system, including which command-line flags to use for watching the video frames in Sandbox.
  • Hex Dumping: The series fixes a typo to enable the cedit dump command and switches its output to the standard U-Boot hexadecimal format.

Bottom line: The series makes Expo more flexible, ensures textlines work everywhere, and improves the code base for easier debugging and maintenance.


Modernising Allocation: U-Boot Upgrades to dlmalloc 2.8.6

For over two decades—since 2002—U-Boot has relied on version 2.6.6 of Doug Lea’s malloc (dlmalloc, old docs) to handle dynamic memory allocation. While reliable, the codebase was showing its age.

In a massive 37-patch series, we have finally updated the core allocator to dlmalloc 2.8.6. This update brings modern memory efficiency algorithms, better security checks, and a cleaner codebase, all while fighting to keep the binary size footprint minimal for constrained devices.

Why the Update?

The move to version 2.8.6 isn’t just about bumping version numbers. The new implementation offers specific technical advantages:

  • Improved Binning: The algorithm for sorting free chunks is more sophisticated, leading to better memory efficiency and less fragmentation.
  • Overflow Protection: Robust checks via MAX_REQUEST prevent integer overflows during allocation requests, improving security.
  • Reduced Data Usage: The old pre-initialised av_[] array (which lived in the data section) has been replaced with a _sm_ struct in the BSS (Block Started by Symbol) section. This change reduces usage in the data section by approximately 1.5KB, a significant win for boards with constraints on initialised data.

The Battle for Code Size

One of the biggest challenges in embedded development is code size. Out of the box, the newer dlmalloc was significantly larger than the old version—a non-starter for SPL (Secondary Program Loader) where every byte counts.

To combat this, the patch series a Kconfig option to strip down the allocator for space-constrained SPL builds (specifically via CONFIG_SYS_MALLOC_SMALL).

Key optimisations include:

  1. NO_TREE_BINS: Disables complex binary-tree bins for large allocations (>256 bytes), falling back to a simple doubly-linked list. This trades O(log n) performance for O(n) but saves ~1.25KB of code.
  2. SIMPLE_MEMALIGN: Simplifies the logic for aligned allocations, removing complex retry fallback mechanisms that are rarely needed in SPL. This saves ~100-150 bytes.
  3. NO_REALLOC_IN_PLACE: Disables the logic that attempts to resize a memory block in place. Instead, it always allocates a new block and copies data. This saves ~500 bytes.

With these adjustments enabled, the new implementation is actually smaller than the old 2.6.6 version on architectures like Thumb2.

Keeping U-Boot Features Alive

This wasn’t a clean upstream import. Over the last 20 years, U-Boot accrued many custom modifications to dlmalloc. This series carefully ports these features to the new engine:

  • Pre-relocation Malloc: Support for malloc_simple, allowing memory allocation before the main heap is initialised.
  • Valgrind Support: Annotations that allow developers to run U-Boot sandbox under Valgrind to detect memory leaks and errors.
  • Heap Protection: Integration with mcheck to detect buffer overruns and heap corruption.

New Documentation and Tests

To ensure stability, a new test suite (test/common/malloc.c) was added to verify edge cases, realloc behaviours, and large allocations. Additionally, comprehensive documentation has been added to doc/develop/malloc.rst, explaining the differences between pre- and post-relocation allocation and how to tune the new Kconfig options.

Next Steps

The legacy allocator is still available via CONFIG_SYS_MALLOC_LEGACY for compatibility testing, but new boards are encouraged to use the default 2.8.6 implementation.


Where did I come from? Introducing the backtrace command

Debugging embedded bootloaders can often feel like working in the dark. When execution crashes or behaves unexpectedly, the first question an engineer usually asks is, “How did I get here?”

Of course, one should always have a JTAG debugger ready to press into service, but so few boards provide a JTAG header.

To help, a recent series introduces a standardised Backtrace Library and a corresponding command to U-Boot. While currently implemented for the sandbox architecture, the design provides a generic API that paves the way for runtime stack traces across other architectures in the future.

The Power of Context

Previously, getting a call stack in U-Boot often meant attaching an external debugger (like GDB) or manually instrumenting code with print statements. This series adds runtime support to look at the backtrace directly from the console.

With the new backtrace command, developers can instantly see the call stack, complete with function names, source filenames, and line numbers.

How it Works

The implementation is split into a generic library and architecture-specific drivers:

  1. Generic API (include/backtrace.h): Provides functions like backtrace_init() to collect the stack and backtrace_show() to print it.
  2. Sandbox Implementation: For sandbox, we use the host’s libbacktrace (bundled with GCC). This allows U-Boot to read the DWARF debug information generated during the build to resolve addresses into human-readable symbols.

Cleaner Output

Raw backtraces can be messy, often printing absolute paths that clutter the terminal. A nice touch in this series (specifically Patch 9) is the automatic stripping of the source tree prefix.

Before:

run_command_list() at /home/user/workspace/u-boot/common/cli.c:168

After:

run_command_list() at common/cli.c:168

Example Usage

Once enabled with CONFIG_CMD_BACKTRACE, using the tool is straightforward:

=> backtrace
backtrace: 14 addresses
  backtrace_show() at lib/backtrace.c:18
  do_backtrace() at cmd/backtrace.c:17
  cmd_process() at common/command.c:637
  run_list_real() at common/cli_hush.c:1868
  parse_stream_outer() at common/cli_hush.c:3207
  parse_string_outer() at common/cli_hush.c:3257
  run_command_list() at common/cli.c:168
  sandbox_main_loop_init() at arch/sandbox/cpu/start.c:153
  board_init_r() at common/board_r.c:774
  ...

Looking Ahead

Currently this feature relies on libbacktrace and is available only for sandbox. However, the infrastructure is now in place. We are looking forward to seeing architecture maintainers implement the backing backtrace_init logic for ARM, RISC-V, and x86 to bring this powerful debugging capability to physical hardware.


Cleaning up the Nulls: Introducing ofnode Stubs for Non-DT Builds

In the world of U-Boot, the Device Model (DM) and Device Tree (DT) are the standard for hardware description. However, U-Boot runs on a massive variety of hardware, including constrained systems where full Device Tree support (OF_REAL) might be disabled.

A recent patch cleans up how the core handles these “no-Device-Tree” scenarios, ensuring that code remains clean, compilable, and safe even when the DT is missing.

The Problem: When the Tree Falls

When OF_REAL is disabled, there is logically no point in trying to find nodes, read properties, or traverse a tree—everything is effectively null.

Previously, handling this required scattering #ifdef guards throughout driver code or dealing with linking errors if a driver attempted to call an ofnode function that wasn’t compiled in. This made the codebase harder to read and harder to maintain.

The Solution: Static Inline Stubs

The patch, dm: core: Create ofnode stubs when OF_REAL is disabled introduces a comprehensive set of static inline “stub” functions in include/dm/ofnode.h.

Here is the logic:

  1. Check Configuration: The header now checks #if CONFIG_IS_ENABLED(OF_REAL).
  2. Provide Stubs: If OF_REAL is off, it defines dummy versions of functions like ofnode_read_u32 or ofnode_next_subnode.
  3. Safe Returns: These stubs return safe default values—typically NULL, false, -ENOSYS, or -EINVAL—allowing the compiler to optimise the code paths without breaking the build.

This allows drivers to call ofnode functions blindly. If the DT is missing, the function simply returns an error code, and the driver handles it gracefully rather than the build failing.

The Cost: Pushing the Limits

While this approach significantly cleans up driver code, it comes with a trade-off. include/dm/ofnode.h has grown significantly with this patch.

As noted in the commit, the file is becoming “a little convoluted” due to the sheer volume of inline implementations and dual definitions. We are likely reaching the limit of how many static inlines can reasonably live in this single header! While this solution is better than the alternative (broken builds or messy #ifdefs in drivers), future work may require splitting the header file to keep the core API definitions digestible and organised.

Key Refinements

The patch also includes some “plumbing” adjustments:

  • Macro Relocation: Iterator macros like ofnode_for_each_compatible_node() were moved outside the OF_REAL condition. Since they rely on the newly created stubs, these loops will now simply do nothing on a non-DT system, rather than causing compiler errors.
  • Edge-Case Support: A specific adjustment in drivers/Makefile ensures ofnode.o is compiled when OF_REAL is enabled but the full DM is not, preserving necessary support for boards like the kontron-sl-mx6ul.


Introducing Codman: A Deep Dive into U-Boot Build Analysis

U-Boot is a massive project. With thousands of files, nearly endless configuration possibilities, and complex Kconfig dependencies, a single board configuration often only compiles a small fraction of the total source tree.

For developers and maintainers, this complexity often leads to difficult questions:

  • “I just enabled CONFIG_CMD_NET; how much code did that actually add?”
  • “How much bloat would I remove by disabling CONFIG_CMDLINE?”
  • “Which specific lines of this driver are active for my board?”

Simply searching for CONFIG_ macros or header inclusions is rarely enough. The build logic takes many forms—Makefile rules, #ifdefs, IS_ENABLED(), and static inlines—making static analysis tricky.

Enter Codman (Code Manager), a new tool designed to cut through this complexity by analysing the actual build artefacts generated by the compiler.

What is Codman?

Codman is a Python-based tool located in tools/codman/. It works out exactly which source files and lines of code are compiled and used for a specific board. It works by:

  1. Building the specified board (or using an existing build).
  2. Parsing .cmd files to find which source files were compiled.
  3. Analysing the source code (using a specialized unifdef) or object files (using DWARF tables) to figure out exactly which lines made it into the final binary.

Feature Highlight: Impact Analysis

One of Codman’s most powerful features is Impact Analysis. This allows you to explore “what if” scenarios without manually editing defconfig files or running menuconfig.

Using the -a (adjust) flag, you can modify the Kconfig configuration on the fly before the analysis runs. This is perfect for seeing exactly how much code a specific feature adds.

Example: Checking the impact of USB To enable the USB subsystem on the sandbox board and see how the code stats change:

./tools/codman/codman.py -b sandbox -a CMD_USB stats

Example: Disabling Networking To see what code remains active when networking is explicitly disabled:

./tools/codman/codman.py -b sandbox -a ~NET,NO_NET stats

Visualising the Build

Codman provides several ways to view your build data.

1. High-Level Statistics The stats command gives you a bird’s-eye view of your build size.

$ codman -b qemu-x86 stats
======================================================================
FILE-LEVEL STATISTICS
======================================================================
Total source files:    14114
Used source files:      1046 (7.4%)
Unused source files:   13083 (92.7%)

Total lines of code:  3646331
Used lines of code:    192543 (5.3%)

2. Directory Breakdown Use dirs to see which subsystems are contributing the most weight to your board.

$ codman dirs
BREAKDOWN BY TOP-LEVEL DIRECTORY
Directory        Files    Used  %Used  %Code     kLOC    Used
-------------------------------------------------------------
arch               234     156     67     72     12.3     8.9
board              123      45     37     25      5.6     1.4
cmd                 89      67     75     81      3.4     2.8
...

You can also break down the information by showing subdirectories (-s) or even individual files (-f).

$ codman -n -b qemu-x86 dirs --subdirs  -f
=======================================================================================
BREAKDOWN BY TOP-LEVEL DIRECTORY
=======================================================================================
Directory                                  Files    Used  %Used  %Code     kLOC    Used
---------------------------------------------------------------------------------------
arch/x86/cpu                                  20      15     75     85      3.8     3.2
  start.S                                    318     190   59.7     128
  cpu.c                                      399     353   88.5      46
  mp_init.c                                  902     877   97.2      25
  turbo.c                                    103      92   89.3      11
  lapic.c                                    158     156   98.7       2
  resetvec.S                                  18      18  100.0       0
  pci.c                                      100     100  100.0       0
  mtrr.c                                     455     455  100.0       0
  start16.S                                  123     123  100.0       0
  sipi_vector.S                              215     215  100.0       0
  ioapic.c                                    36      36  100.0       0
  call32.S                                    61      61  100.0       0
  qfw_cpu.c                                   86      86  100.0       0
  irq.c                                      366     366  100.0       0
  cpu_x86.c                                   99      99  100.0       0
arch/x86/cpu/i386                              4       4    100     98      1.4     1.4
  cpu.c                                      649     630   97.1      19
  interrupt.c                                630     622   98.7       8
  call64.S                                    92      92  100.0       0
  setjmp.S                                    65      65  100.0       0
arch/x86/cpu/intel_common                     18       6     33     23      3.3     0.8
  microcode.c                                187     183   97.9       4
  pch.c                                       23      23  100.0       0
  lpc.c                                      100     100  100.0       0

3. Line-by-Line Detail Perhaps the most useful feature for debugging configuration issues is the detail view. It shows you exactly which lines are active or inactive within a file.

$ codman -b qemu-x86 detail common/main.c
...
    24 | static void run_preboot_environment_command(void)
    25 | {
    26 | 	char *p;
    27 | 
    28 | 	p = env_get("preboot");
    29 | 	if (p != NULL) {
    30 | 		int prev = 0;
    31 | 
-   32 | 		if (IS_ENABLED(CONFIG_AUTOBOOT_KEYED))
-   33 | 			prev = disable_ctrlc(1); /* disable Ctrl-C checking */
    34 | 
    35 | 		run_command_list(p, -1, 0);
    36 | 
-   37 | 		if (IS_ENABLED(CONFIG_AUTOBOOT_KEYED))
-   38 | 			disable_ctrlc(prev);	/* restore Ctrl-C checking */
    39 | 	}
    40 | }
    41 | 
...

(Lines marked with - are not included in the build and show in a different colour)

Under the Hood: Unifdef vs. DWARF

Codman supports two methods for analysis:

  • Unifdef (Default): Simulates the C preprocessor to determine which lines are active based on CONFIG_ settings. It is fast (leveraging multiprocessing) and provides a great preprocessor-level view. It uses a patched version of unifdef that supports U-Boot’s IS_ENABLED() macros.
  • DWARF (-w): Rebuilds the project with debug info and analyses the DWARF line number tables. This is highly accurate for executable code but won’t count declarations or comments.

Getting Started

# Basic stats for sandbox
./tools/codman/codman.py -b sandbox stats

# Find unused files
./tools/codman/codman.py -b sandbox unused

# Extract only used sources to a new directory (great for minimal distributions)
./tools/codman/codman.py -b sandbox copy-used /tmp/minimal-tree

Check the documentation for more details!