A recent series in Concept enables ext4l for an ARM board, finally allowing us to make a concrete comparison between the code size of this new Linux-ported driver and the existing U-Boot implementation.
Here is a short note on what we found.
The “Linux is Large” Reality
The first observation is that the Linux kernel no longer operates under strict code-size constraints. In the early days of embedded Linux, there was immense pressure to keep footprints tiny—projects like uClinux aimed to run in very limited RAM. Today, even embedded CPUs often have gigabytes of RAM, and they run the full kernel without blinking.
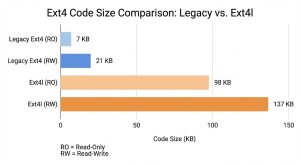
This shift shows through in the code. One striking example: ext4l contains about 20KB just in error messages and warnings. To put that in perspective, those strings alone take up roughly the same amount of space as the entire code size of the existing, legacy ext4 implementation in U-Boot!
Shoehorning a modern Linux filesystem driver into a bootloader was always going to involve trade-offs. Now, we have the numbers to quantify them.
The Weigh-in: Early Results
So, how heavy is ext4l? We ran comparisons on Thumb2 (specifically the firefly-rk3288).
New Ext4l: ~98KB (Read-Only) / ~137KB (Read-Write)
There is no getting around it: ext4l is significantly heavier.
Is the Size Worth It?
The short answer is: Yes, because the legacy driver is becoming obsolete.
U-Boot’s existing ext4 implementation is losing utility in the modern world. Most modern Linux distributions enable metadata checksums (metadata_csum) by default, rendering their filesystems unmountable by the current U-Boot driver. While the legacy driver has basic journaling, it lacks support for fast-commits and other features required to interact safely with real-world partitions.
Despite the size increase, ext4l provides feature-parity with Linux, allowing U-Boot to reliably interact with modern filesystems.
The Path Forward: Top-Down or Bottom-Up?
We are currently taking a “Top-Down” approach: porting the full-featured Linux driver (ext4l) and then looking for size reductions. There are likely areas we can trim, but we must be careful not to spoil one of ext4l‘s major benefits: a small code delta compared to Linux, which makes maintenance easier.
However, there is a potential “Bottom-Up” path: we could enhance the legacy ext4 driver just enough to support required features like checksums, without importing the full Linux architecture. The end result would likely land somewhere in the middle—smaller than ext4l, but larger than the current legacy driver.
The downside? It creates a distinct codebase that requires its own maintenance, separate from the kernel.
For now, ext4l gives us compatibility today, but the hunt for optimization continues.
Modernizing Buildman: A Case Study in AI-Assisted Refactoring
written by Simon Glass | 30 January 2026
U-Boot’s suite of Python tools—including buildman, patman, and binman—are critical parts of our development workflow. However, like any long-lived software project, technical debt accumulates. Buildman in particular was written a while ago, without much use of pylint and has grown significantly over the years. The accumulated pylint warnings, inconsistent naming conventions, and a monolithic structure make maintenance somewhat difficult.
On the other hand, cleaning up Python code is error-prone and not a lot of fun! A few recent series (board, general, builderthead and test.py) has shown a different path: extensive use of AI as a co-developer to accelerate the cleanup.
The Problem: Entropy
The buildman code has several issues typical of older Python codebases:
Monolithic Class: The TestBuild class had become a dumping ground for all tests, making it hard to navigate.
Legacy Formatting: Reliance on % string formatting instead of modern f-strings.
PEP 8 Violations: A mix of CamelCase and snake_case method names, missing docstrings, and indentation inconsistencies.
Pylint Noise: A high volume of warnings that obscured actual logic errors.
The AI Advantage
Refactoring code to fix style issues is often tedious and error-prone. For this series, we used Claude Opus 4.5 to handle the heavy lifting. The AI was particularly effective at:
Mechanical Translations: Converting hundreds of lines from % formatting to f-strings and renaming variables from CamelCase to snake_case to match PEP 8 standards.
Logic Extraction: Helping to identify seams in the code where the massive TestBuild class could be split into logical components.
Docstring Generation: Analyzing test methods and generating accurate, compliant docstrings where they were missing.
By offloading these tasks, we can focus on the architectural decisions while the AI handled the syntax updates. Each commit in the series carries a Co-developed-by tag, acknowledging the AI’s contribution to the code generation.
Most importantly, this clean-up can be largely a background task. In between other work, switch back to the clean-up terminal every now and then and spend a few minutes looking at what was done and deciding what to do next.
Key Architectural Improvements
The most significant change in the latest series is the decomposition of the TestBuild class.
Previously, TestBuild handled everything from output parsing to toolchain management. Now it is split into focused classes:
TestBuildBase: Common setup and teardown logic.
TestBuildOutput: Tests specific to summary display and error formatting.
TestBuildMisc: Process limits and other edge cases.
This separation of concerns makes the tests easier to read and understand.
The other series linked have adopted a similar approach – splitting code into separate functions to make it easier to read and maintain.
AI coding tools have a clear advantage in refactoring. They can fairly reliably extract code into functions and make other adjustments that are beyond a mere ‘refactor’ tool in VS Code or Eclipse, for example. It is also easy to go back to an earlier commit in the series to bring in a change, then continue the rebase and have the AI deal with merge conflicts.
Conclusion
This cleanup so far brings most of the buildman code into full pylint compliance (with some pragmatic disable-directives where necessary). It serves as a good example of how AI tools can be leveraged to modernize legacy infrastructure code in the U-Boot project, turning a multi-day refactoring slog into a manageable, efficient process.
Faster Tests and Better Debugging: Improvements to Malloc and test/py
written by Simon Glass | 30 January 2026
Developing for U-Boot often involves chasing down elusive memory leaks and waiting for long test suites to finish. A recent series of 29 patches is aimed squarely at improving the developer experience in these areas.
This series introduces powerful new malloc debugging tools, optimises the video subsystem, and significantly improves the performance of the test/py infrastructure.
Deep Dive into Malloc Debugging
Finding memory leaks in a bootloader can be painful. This series adds several features to the malloc subsystem, particularly for sandbox, to make this process more transparent.
Malloc Traffic Log
A new logging feature records every malloc, free, and realloc call into a circular buffer. This includes the pointer address, allocation size, and the caller’s backtrace.
You can control this via the new malloc log command:
Each entry shows the operation type, the address and size and the caller trace, so you can figure out where it happened.
File Output for Heap Dumps
To make comparing heap states easier, new functions malloc_dump_to_file() and malloc_log_to_file() allow you to write the heap state directly to a file on the host system (when running U-Boot sandbox). This enables a simple workflow for finding leaks:
Dump heap to before.txt
Run your test case
Dump heap to after.txt
Use diff or comm on the host to identify pointers that persist.
Performance Improvements
Video and Truetype Optimization
Rendering text on the video console was identified as a performance bottleneck during testing.
Truetype Scratch Buffer: The stb_truetype library previously performed around 5 allocations per character. We added a pre-allocated scratch buffer, drastically reducing malloc pressure.
Full-line Copy: The video_flush_copy() function is now optimised to detect full-line damage, allowing for single memcpy calls instead of looping pixel-by-pixel or small chunks.
Accelerating test/py
Running the full test suite can be CPU intensive. This series addresses inefficiencies in how test/py handles console output.
VT100 Filtering: The logic to filter escape sequences was previously O(N^2). It has been optimised to filter only new data, significantly reducing overhead on verbose tests.
CPU Usage: A tiny delay has been added before polling the console pipe to allow data to accumulate (up to 4KB). This simple change reduced CPU usage by approximately 30% during intensive output operations.
Additional Features
Gprof Support: You can now build sandbox with GPROF=1 to generate profiling data (gmon.out) for analysis with standard GNU tools.
Runtime Mcheck Disable: A new -M flag allows you to disable mcheck heap protection at runtime, useful when the overhead interferes with specific timing-sensitive tests.
These changes make the U-Boot sandbox a faster, more observable environment for development!
Ext4l: Bringing Full Write Support to the Linux-Ported Filesystem
written by Simon Glass | 30 January 2026
The effort to modernise U-Boot’s filesystem support continues with a major update to ext4l—the new ext4 driver ported directly from Linux. A recent series series of 30 patches that brings full write capabilities to the driver.
So far ext4l has only supported reading. With this series, the driver now supports the full lifecycle of file management, including file creation, modification, and deletion, all while using the journal for crash-safety.
What’s New?
The new series adds support for the following operations:
File Write: You can now write files using the journal for data integrity.
Deletion: Support for unlink to remove files.
Directories: Implementation of mkdir to create new directories.
Symbolic Links: Support for ln to create symlinks.
Renaming: Full support for renaming and moving files and directories.
Additionally, unlike the legacy ext4 driver, ext4l supports metadata_csum checksums, allowing U-Boot to interact with modern ext4 partitions without disabling features.
Adapting Linux Code for a Bootloader
Porting filesystem code from Linux to U-Boot presents unique challenges regarding resource management.
In the Linux kernel, the filesystem driver doesn’t need to meticulously free every single resource the moment a filesystem is unmounted; it can rely on the kernel’s broader memory management to clean up caches or reuse structures later.
U-Boot, however, operates differently. The bootloader might mount and unmount filesystems multiple times during a single session—for example, when running an extensive test suite or loading kernels and device trees from different partitions. If resources aren’t freed explicitly, memory leaks accumulate, eventually causing allocation failures.
To address this, this series includes significant infrastructure improvements that go beyond the Linux upstream code:
Aggressive Cleanup: We implemented thorough cleanup of journal references and buffer heads upon unmount to prevent memory leaks.
Safety Guards: Added safeguards to handle probe calls without explicit close calls from previous sessions.
Use-After-Free Prevention: Logic was added to prevent freeing buffer heads that still have active journal heads attached.
Testing and Next Steps
This series enables ext4l for sandbox testing, allowing us to validate these features rapidly without hardware. It also includes tweaks to the video console (a new --quiet_vidconsole flag) to speed up verbose test outputs.
While ext4l is now functional and usable for read/write operations, there is still work to be done before it could perhaps replace the existing ‘ext4’ driver: enabling the driver for ARM and x86 targets, fine-tuning Kconfig options to optimise code size, and expanding the documentation.
But for now, this is a significant step toward having a robust, modern, and maintainable ext4 implementation in U-Boot!
Note: This work was brought to you with the assistance of Claude and the city of Wuhan, China.
uman: A New Developer Companion for U-Boot
written by Simon Glass | 30 January 2026
Developing for U-Boot often involves juggling a variety of tools: buildman for compilation, patman for patch submission, test.py for integration testing, and git for version control. While these tools are powerful individually, orchestrating them—especially when dealing with complex CI pipelines and dependencies—can be tedious.
To bridge these gaps, we are introducing uman (U-Boot Manager), a new command-line tool headed for Concept, designed to streamline the daily workflow of U-Boot developers.
uman unifies build, test, and CI interaction into a single interface, handling the “glue” logic that developers usually script themselves.
1. Taming the CI Pipeline
One of the biggest friction points in development is pushing to GitLab CI. Often, you only need to run a specific set of tests, but the default pipeline runs everything. uman ci gives you fine-grained control over what runs via git push options, without needing to manually edit YAML files.
# Push to CI, but ONLY run the pytest suite (skip world build)
uman ci -p

# Push to CI, but only run tests for the 'sandbox' board
uman ci -p sandbox

# Push and automatically create (or update) a Merge Request
uman ci -m
2. Simplified Local Testing
Running U-Boot’s pytest framework locally requires setting up environment variables, finding the correct build directory, and passing specific flags. uman py automates this. It detects your source tree, sets up paths for hooks, and handles board configuration.
# Run pytests for sandbox (automatically builds u-boot first)
uman py -b sandbox

# Run a specific test, keeping artifacts for inspection
uman py -b sandbox test_vbe -P
For developers working on C-based unit tests, uman introduces a C-Test Direct Runner (-C). If you have already set up the test environment (using -S -P), you can iterate rapidly on the C code without reloading the Python test harness every time:
# Fast iteration on a C test
uman py -C fs_test_ext4l_probe
3. Dependency Management
Testing often requires external firmware blobs (OpenSBI, TF-A, QEMU). Previously, developers had to manually hunt these down. uman setup automates fetching and building these dependencies.
# Download and install QEMU, OpenSBI, and toolchains needed for testing
$ uman setup
Setting up qemu...
All QEMU packages are installed
Setting up opensbi...
Downloading OpenSBI v1.3.1...
OpenSBI rv64: /home/sglass/dev/blobs/opensbi/fw_dynamic.bin
OpenSBI rv32: /home/sglass/dev/blobs/opensbi/fw_dynamic_rv32.bin
Setting up tfa...
Cloning TF-A...
Cloning into '/home/sglass/dev/blobs/tfa/src'...
remote: Counting objects: 6639, done
remote: Finding sources: 100% (6639/6639)
remote: Total 6639 (delta 686), reused 4523 (delta 686)
Receiving objects: 100% (6639/6639), 12.94 MiB | 10.11 MiB/s, done.
Resolving deltas: 100% (686/686), done.
Building TF-A for QEMU SBSA...
TF-A bl1: /home/sglass/dev/blobs/tfa/bl1.bin
TF-A fip: /home/sglass/dev/blobs/tfa/fip.bin
Setting up xtensa...
Downloading Xtensa dc233c toolchain...
Xtensa already configured in ~/.buildman
Xtensa toolchain: /home/sglass/dev/blobs/xtensa/2020.07/xtensa-dc233c-elf
Setup complete
4. Build Management
While buildman is excellent, uman build provides a quick wrapper for common development tasks, such as forcing a fresh build, enabling Link Time Optimization (LTO), or inspecting binary sizes immediately after a build.
# Build sandbox and show the size of the resulting binaries
uman build sandbox --size

# Build with disassembly output for debugging
uman build sandbox -O
Configuration
uman is designed to work out of the box, but it is also configurable via ~/.uman, allowing you to define persistent paths for builds, firmware blobs, and test hooks.
This tool aims to reduce the “context switching” overhead in U-Boot development, letting you focus more on the code and less on the tooling parameters.
Future
uman takes advantage of some of the newer features in Concept but it is compatible with the main tree also.
uman development is in its early stages and will expand over time. For now it is in a separate github repo. If you try it out, please send some feedback on the mailing list. For now, PRs are welcome!
Levelling Up U-Boot’s Test Infrastructure
written by Simon Glass | 30 January 2026
Testing is the backbone of U-Boot development, but as the test suite grows, so does the friction involved in running it. Whether it is the time it takes to regenerate disk images or the difficulty of parsing test output in CI, there is always room for improvement.
A recent series of 9 patches in Concept smooths out several rough edges in the unit-test (ut) infrastructure. These changes focus on speed, directory cleanliness, and better automation support.
Faster Iteration with Persistence
One of the biggest time-sinks when iterating on C-based filesystem / boot tests is the Python-fixture setup. Every time you ran a test, the system generates fresh disk images, which is slow and repetitive if the images haven’t actually changed.
A new --persist (or -P) flag is now available in the Python-test runner. This tells the system to keep test artefacts—like disk images—after the run completes. Combined with updates to the test drivers, you can now re-run specific C tests immediately without waiting for the Python layer to regenerate the world.
A Cleaner Source Tree
Historically, tests tended to dump their temporary disk images (mmc1.img, spi.bin, etc.) directly into the source tree. This cluttered the workspace and requires a git-ignore rule to avoid making git status noisy.
This series moves all test-generated disk images to the persistent-data directory, i.e. inside the build directory. This keeps your source tree clean and groups all transient test-data in one predictable location.
Parallel Execution Support
Running the full unit test suite on a single core takes a while. Just the driver model tests alone (ut dm) take 13 seconds even on a fast machine. As a step towards improving this, we added support for parallel execution to the ut command.
You can now use the -P <n>:<w> flag to shard tests across multiple sandbox instances. For example, if you want to split the work across 4 workers, you can launch 4 separate sandbox processes:
The tests are distributed by index, ensuring a disjoint subset for each worker.
Automation and CLI Improvements
Several changes are included to make the ut command friendlier for both humans and machines:
Machine-Readable Output: A new -E flag emits explicit Result: PASS: ... or Result: FAIL: ... lines after each test. This eliminates the need for fragile regex parsing in CI scripts to determine exactly which test failed.
Combined Flags: You can finally combine single-character flags. Instead of typing ut -f -m -E, you can now simply run ut -fmE.
Manual Test Alias: The -m flag was added as an alias for -f (force), making it more intuitive to run “manual” tests.
These improvements should make the testing experience faster and less intrusive for everyday development.
What’s next?
A new tool is in the works to help productivity when running tests. Watch this space!
Safety at Scale: Introducing check and Per-Commit Validation in pickman
written by Simon Glass | 30 January 2026
Automating cherry-picks with AI (as seen in our introduction to pickman) was a huge step forward for U-Boot Concept maintenance. However, as any maintainer knows, theory and practice often collide when you try to apply 260+ commits in a single session.
After several weeks of real-world use, we’ve identified three “stress points” in large-scale cherry-picking:
The Detail Gap: It’s hard to see if a cherry-pick subtly mangled the code just by looking at a GitLab GUI.
Ghost Commits: Effort is often wasted cherry-picking commits that were already merged via a different path.
Delayed Failure: Building only at the end of a 200-commit series means catching a mistake at commit #5 requires a massive amount of backtracking.
A recent series introduces a suite of safety features to address these challenges.
1. The check Command: Catching “Mangled” Commits
The star of this update is the new check command. It provides a simple, high-level audit of the “delta” between an original commit and its cherry-picked version.
If a cherry-pick results in a significantly different file structure or line count compared to the original, pickman flags it for review:
 Cherry-pick Delta% Original   Subject
 ----------- ------ ---------- -------
 aaea489b2a     100 9bab7d2a7c net: wget: let wget_with_dns work with...
 e005799d8f      33 15e0c5e390 lmb: Remove lmb_alloc_addr_flags()
 c347fb4b1a      41 99145eec2d x86: select CONFIG_64BIT for X86_64
 12 problem commit(s) found
By adding the -d (diff) option, you can see a direct patch-to-patch comparison, making it easy to spot exactly where a conflict resolution went off the rails.
2. Move Fast, Check Often: Per-Commit Validation
We have updated the AI agent prompt to be much more proactive. Instead of blindly applying a series and hoping for the best, the agent now:
Checks Deltas Immediately: After every successful cherry-pick, it compares the new commit stat against the original.
Builds Every Commit: It runs buildman after every single commit. This ensures the tree remains in a “good” state throughout the entire process.
Self-Correction: If a delta is too large (>20%), the agent will now attempt to reset and manually apply the changes using git apply --3way before moving forward.
3. Smarter “Already-Applied” Detection
Duplicate commits are a constant headache. pickman now includes a robust detection system that looks for matching subjects in the target branch (ci/master) before it starts work.
It doesn’t just match text; the agent now compares actual patch content. It will only skip a commit if it can be verified as the same with good confidence, drastically reducing false positives.
Key Commands in this Series
Command
Description
pickman check
Identifies suspect cherry-picks based on delta ratio.
pickman check -d
Shows a source code diff of the patch differences.
pickman check -v
Shows detailed stats for all commits on the current branch.
Quality and Compliance
Beyond features, this series brings the pickman codebase up to production standards. We’ve enforced 80-column compliance, cleared numerous pylint warnings, and transitioned to using Named Tuples (like AgentCommit) to ensure the code is as readable as the commits it manages.
These refinements mark a step along the path to turn pickman from an experimental AI helper into a robust repository maintenance tool.
Silencing the Sphinx: Cleaner Documentation Builds
written by Simon Glass | 30 January 2026
If you have ever run make htmldocs in U-Boot, you are likely familiar with the “wall of text” it produces. Between the standard Sphinx output, sub-make messages, and custom progress indicators, the build process has traditionally been very noisy.
While verbose output can be useful for debugging the toolchain itself, it is a hindrance when you are just trying to write documentation. The sheer volume of text makes it difficult to spot legitimate warnings and errors, which often get buried in the scroll.
A recent 5-part series in Concept addresses this. The goal is simple: if the build prints something, it should be something that requires your attention.
What changed?
The series cleans up the output in three specific ways:
Enabling Quiet Mode: We now pass the -q flag to SPHINXOPTS and -s to the sub-make invocations. This suppresses the standard “reading sources” and “picking up dependencies” log lines.
Removing Informational Clutter: We dropped the explicit print statement regarding CJK (Chinese/Japanese/Korean) font support in conf.py. The functionality remains, but we don’t need to be told about it on every run.
Dropping Custom Progress Bars: The SPHINX and PARSE progress messages defined in the Makefiles have been removed.
The Result
The documentation build is now silent by default. This aligns the htmldocs target with the philosophy of the rest of the Kbuild system: silence is golden.
Now, when you run the docs build, you can be confident that any output appearing in your terminal is a warning or an error that needs to be fixed. This should make it significantly easier to maintain clean documentation and spot regressions in CI.
Porting Linux’s EXT4 to U-Boot: Introducing ext4l
written by Simon Glass | 30 January 2026
In the world of bootloaders, balance is everything. We need enough functionality to load an OS, but we must keep the footprint small and the code maintainable. For years, U-Boot has relied on a custom implementation of the EXT4 filesystem. However, as the EXT4 format evolves with features like metadata checksums and fast commits, keeping a custom implementation in sync with the Linux kernel becomes a monumental task.
Today, we are excited to share a major milestone in U-Boot’s filesystem support: the introduction of ext4l.
What is ext4l?
The ext4l driver (the ‘l’ stands for Linux) is a direct port of the Linux kernel’s EXT4 driver (from v6.18) into U-Boot. Instead of rewriting the logic, we have imported the actual kernel source files—including super.c, inode.c, mballoc.c, and the jbd2 journaling layer—and provided a thin compatibility shim to make them “feel at home” in U-Boot.
Why This Approach?
Feature Parity: By using the real kernel code, we gain immediate support for modern EXT4 features like extents, flex_bg, and CRC32C metadata verification.
Maintainability: When the Linux kernel community fixes a bug or adds an optimization, we can pull those changes into U-Boot with minimal friction.
Reliability: We are leveraging code that has been battle-tested on millions of production servers and devices.
The Engineering Journey: Stubs and Shims
Porting kernel code to a bootloader is no small feat. The Linux kernel assumes a rich environment of threads, complex memory management, and a full VFS (Virtual File System) layer. U-Boot, by comparison, is largely single-threaded and simplified.
To bridge this gap, we developed a sophisticated compatibility layer:
ext4_uboot.h & stub.c: These files provide the “glue.” They map kernel structures like struct super_block and struct inode to U-Boot’s block I/O layer.
Dummy Shrinkers & Mutexes: Since U-Boot doesn’t have the same memory pressure or concurrency requirements, we implemented “no-op” or dummy versions of kernel infrastructure like the memory shrinker and various locking primitives.
Buffer Cache: We added a buffer_head I/O infrastructure to support caching, which significantly improves read performance during the boot process.
Key Milestones in the Patch Series
The journey to a successful mount was achieved through a systematic build-up of the filesystem stack:
Component
Description
The Foundation
Importing core files from Linux 6.18 (inode.c, extents.c, super.c).
JBD2 Support
Porting the Journaling Block Device layer to ensure compatibility with journaled filesystems.
The Glue
Implementing sb_getblk, sb_bread, and brelse to connect the kernel code to U-Boot’s disk drivers.
The Fixes
Resolving critical issues in rbtree implementations and implementing the Castagnoli CRC32C algorithm for checksums.
Success
The final commit ee3d2214 enables successful read-only mounting, allowing U-Boot to see the root dentry and traverse the filesystem.
Current Status
As of the latest commits, ext4l is capable of:
Mounting EXT4 filesystems in read-only mode.
Verifying metadata via CRC32C.
Using the extent status cache for efficient file lookups.
Toggling debug output via CONFIG_EXT4L_DEBUG.
While the long-term goal is to support write operations (the mballoc and transaction code is already building), we are prioritizing rock-solid read support for the current release.
How to Try It
You can enable the new driver in your board configuration by selecting:
CONFIG_FS_EXT4L=y
This will replace the legacy EXT4 implementation with the Linux-ported version. We encourage developers to test this on various hardware and provide feedback on the mailing list.
A special thanks to Claude Opus 4.5 for co-developing these patches and assisting with the extensive stubbing required to bring this to life.
Introducing Pickman: AI-Powered Cherry-Pick Management for U-Boot
written by Simon Glass | 30 January 2026
Managing cherry-picks across multiple branches is one of the more tedious aspects of maintaining a large project like U-Boot. When you need to backport dozens of commits from an upstream branch while handling merge commits, resolving conflicts, and creating merge requests, the process can consume hours of developer time.
Today we’re introducing pickman, a new tool in the U-Boot Concept tree that automates cherry-pick workflows using AI assistance. Pickman combines database tracking, GitLab integration, and the Claude Agent SDK to transform what was once a manual, error-prone process into a streamlined, largely automated workflow.
The Problem
U-Boot maintainers regularly need to cherry-pick commits from upstream branches (like us/next) to integration branches. This involves:
Identifying which commits haven’t been cherry-picked yet
Handling merge commits that group related changes
Resolving conflicts when commits don’t apply cleanly
Creating merge requests for review
Tracking which commits have been processed
Responding to review comments on merge requests
With hundreds of commits to process, this becomes a significant time investment. Pickman aims to reduce this burden dramatically.
How Pickman Works
Database Tracking
Pickman maintains a local SQLite database (.pickman.db) that tracks:
Source branches being monitored
The last cherry-picked commit for each source
Individual commit status (pending, applied, conflict, skipped)
Merge requests created and their status
Processed review comments
This persistent state allows pickman to resume work across sessions and avoid re-processing commits that have already been handled.
AI-Powered Cherry-Picking
The core innovation in pickman is its use of the Claude Agent SDK to handle the actual cherry-pick operations. When you run pickman apply, the tool:
Identifies the next set of commits to cherry-pick (typically grouped by merge commit)
Creates a new branch for the work
Invokes Claude to perform the cherry-picks
Claude handles any conflicts that arise, using its understanding of the codebase
Records the results in the database
Optionally pushes and creates a GitLab merge request
The AI agent can resolve many common conflicts automatically, understanding context like renamed files, moved code, and API changes. When it encounters something it can’t resolve, it reports the issue clearly.
GitLab Integration
Pickman integrates directly with GitLab to:
Push branches and create merge requests automatically
Monitor MR status (open, merged, closed)
Fetch and process review comments
Update the database when MRs are merged
This creates a closed loop where pickman can operate continuously, creating an MR, waiting for it to be reviewed and merged, then moving on to the next batch of commits.
Getting Started
Prerequisites
# Install the Claude Agent SDK
pip install claude-agent-sdk

# Install the GitLab API library
pip install python-gitlab

# Set up your GitLab token (or use ~/.config/pickman.conf)
export GITLAB_TOKEN="your-token-here"
Basic Usage
# Add a source branch to track
pickman add-source us/next abc123def

# See what commits are pending
pickman next-set us/next

# Apply the next batch of commits
pickman apply us/next --push

# Check comments on open merge requests, taking action as needed
pickman review --remote ci

# Run continuously until stopped
pickman poll us/next --interval 300
Key Commands
Command
Description
add-source
Register a new source branch to track
compare
Show differences between branches
next-set
Preview the next commits to be cherry-picked
apply
Cherry-pick commits using Claude
step
Process merged MRs and create new ones
poll
Run step continuously at an interval
review
Check MRs and handle review comments
count-merges
Show how many merges remain to process
The Workflow in Practice
A typical workflow using pickman looks like this:
# Initial setup - track the upstream branch starting from a known commit
$ pickman add-source us/next e7f94bcbcb0

# See how much work there is
$ pickman count-merges us/next
Found 47 merge commits to process

# Preview what's coming next
$ pickman next-set us/next
Next 3 commits to cherry-pick from us/next:
  - a1b2c3d: arm: Fix cache alignment issue
  - d4e5f6a: drivers: gpio: Add new driver
  - b7c8d9e: Merge "ARM improvements"

# Let pickman handle it
$ pickman apply us/next --push --remote ci --target master
Creating branch cherry-a1b2c3d...
Cherry-picking 3 commits...
Pushing to ci...
Creating merge request...
MR created: https://gitlab.com/project/-/merge_requests/123

# Later, process any review comments and continue
$ pickman poll us/next --remote ci --interval 300
The Human Review Loop
While pickman automates much of the cherry-pick process, human oversight remains central to the workflow. The tool is designed to work alongside maintainers, not replace them. Here’s how the review cycle works:
1. MR Creation
When pickman creates a merge request, it includes a detailed description with the source branch, list of commits, and a conversation log showing how Claude handled the cherry-picks. This gives reviewers full visibility into what happened.
2. Human Review
Maintainers review the MR just like any other contribution. They can:
Examine the diff to verify the cherry-pick is correct
Check that conflicts were resolved appropriately
Request changes by leaving comments on specific lines
Ask questions about why certain decisions were made
3. Automated Comment Handling
When reviewers leave comments, pickman’s review command detects them and invokes Claude to address the feedback:
$ pickman review --remote ci
Found 1 open pickman MR(s):
  !123: [pickman] arm: Fix cache alignment issue
Processing comments for MR !123...
  Comment from maintainer: "This variable name should match the upstream style"
  Addressing comment...
  Pushing updated branch...
Claude reads the comment, understands the requested change, modifies the code accordingly, and pushes an updated branch. The merge-request notes are updated with the new transcript. The database tracks which comments have been processed to avoid duplicate work.
4. Iteration
The review cycle can repeat multiple times. Each time a reviewer adds new comments, running pickman review or pickman poll will detect and address them. This continues until the reviewer is satisfied with the changes.
5. Approval and Merge
Once the maintainer is happy with the MR, he or she approves and merges it through GitLab’s normal interface. Pickman detects the merged status on its next step or poll cycle:
$ pickman step us/next --remote ci --target master
Checking for merged MRs...
  MR !123 has been merged - updating database
  Source us/next: abc123 -> def456
Creating next MR...
  Cherry-picking commits from def456...
  MR created: https://gitlab.com/project/-/merge_requests/124
The database is updated to record the new “last processed” commit, and pickman automatically moves on to the next batch of commits.
The Continuous Loop
With pickman poll, this entire cycle runs continuously:
$ pickman poll us/next --remote ci --target master --interval 300
Polling every 300 seconds (Ctrl+C to stop)...

[09:00] Checking for merged MRs... none found
[09:00] Checking for review comments... none found
[09:00] Open MR !123 pending review
[09:00] Sleeping 300 seconds...

[09:05] Checking for merged MRs... none found
[09:05] Checking for review comments... 2 new comments on !123
[09:05] Addressing comments...
[09:05] Pushed updates to MR !123
[09:05] Sleeping 300 seconds...

[09:10] Checking for merged MRs... !123 merged!
[09:10] Updated database: us/next now at def456
[09:10] Creating new MR for next commits...
[09:10] MR !124 created
[09:10] Sleeping 300 seconds...
The maintainer simply reviews each MR as it appears, adds comments when needed, and merges when satisfied. Pickman handles everything else automatically, creating a smooth continuous integration pipeline for cherry-picks. If manual intervention is needed, you can typically just make some edits and push an update to the branch.
Handling Merge Commits
One of pickman’s key features is intelligent handling of merge commits. Rather than cherry-picking merge commits directly (which often fails), pickman identifies the individual commits within a merge and processes them as a group. This ensures that related changes stay together in a single merge request.
The tool follows the first-parent chain to identify merge boundaries, which matches the typical workflow of merging topic branches into the main development branch.
History Tracking
Pickman maintains a .pickman-history file in the repo that records each cherry-pick operation, including:
Date and source branch
Branch name created
List of commits processed
The full conversation log with Claude
This provides an audit trail and helps with debugging when things don’t go as expected.
Future Directions
Pickman is an experimental tool. We will use the next few months to refine it and learn how best to envolve it.
Try It Out
Pickman is available in the U-Boot Concept tree under tools/pickman/. To run the tests:
$ ./tools/pickman/pickman test
We welcome feedback and contributions. If you maintain a branch that requires regular cherry-picks from upstream, give pickman a try and let us know how it works for your workflow.
Pickman was developed with significant assistance from Claude (Anthropic’s AI assistant) for both the implementation and the cherry-pick automation itself.